【饶毅实验室发现GPCR新配体、提出急性胰腺炎发病新机理、揭示治疗胆汁性急性胰腺炎的药物新靶标】
2024年2月2日,自振滔和饶毅发表一篇论文,主要三点:首先,GPR39有新的配体:胆酸;其次,发现胆酸作用的新信号途径;第三,发现胆酸可以通过GPR39而引起急性胰腺炎。
GPR39是七重跨膜的G蛋白偶联受体(GPCRs)之一。与所有GPCR一样,其七重跨膜区域每一个对于其发挥正常功能都是必需的、不能缺少任何一重跨膜,这一结论在全世界上哪个国家和地区都一样,在全人类、地球上全部生物都一样。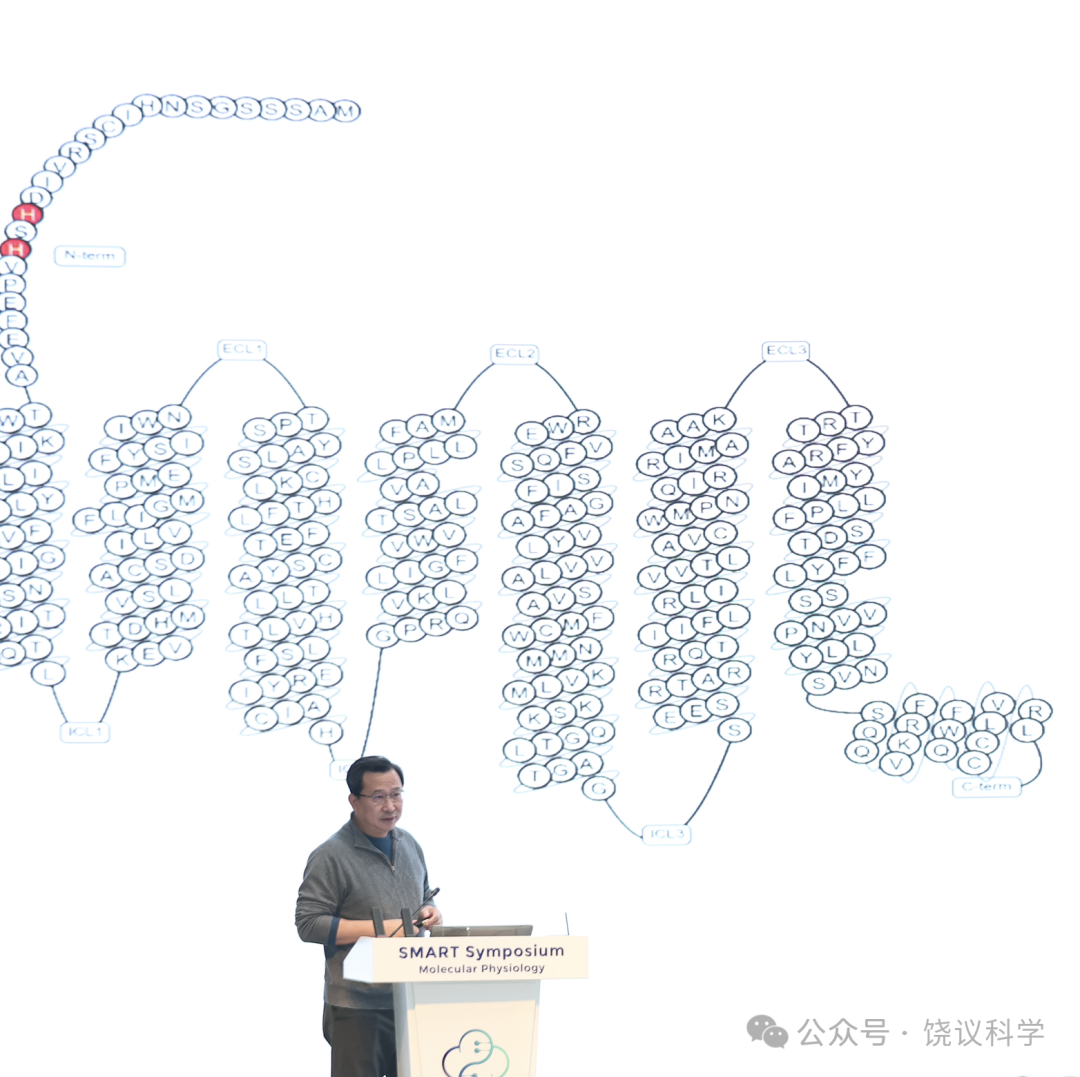
GPCR是非常重要的细胞膜上接收细胞外信号的分子。它们不仅参与很多生理学功能,而且参与疾病发生,对于制药工业尤其重要。迄今为止,它们是全世界药物最大的靶标。约一百三十多种GPCR是迄今美国药监局批准的药物中35%以上的靶标。如根据肾上腺素能受体的配体找到的药物成为几十年来常用的降血压药物。但是,还有一百多种GPCR没有配体,所以其功能不明。找到所谓GPCR配体(“脱孤”)是全世界研究GPCR者最大的目标,也是全世界多个大药厂猛力追求所在。但是,近十几年,困难重重,曾经有几年全世界一年没找到一个配体(Laschet et al., 2018; Levoye and Jockers, 2008; Oh et al., 2006)。GPCR的结构也很重要,特别是在长期不能解的情况下,斯坦福大学Brian Kolbilka实验室在十几年前带来突破。而后来追从Kolbilka足迹的实验室就很多,在GPCR结构细节上有很多进展。但最重要的找新配体的研究困难重重,因为不容易、不热门,我国参与脱孤研究的就非常少。
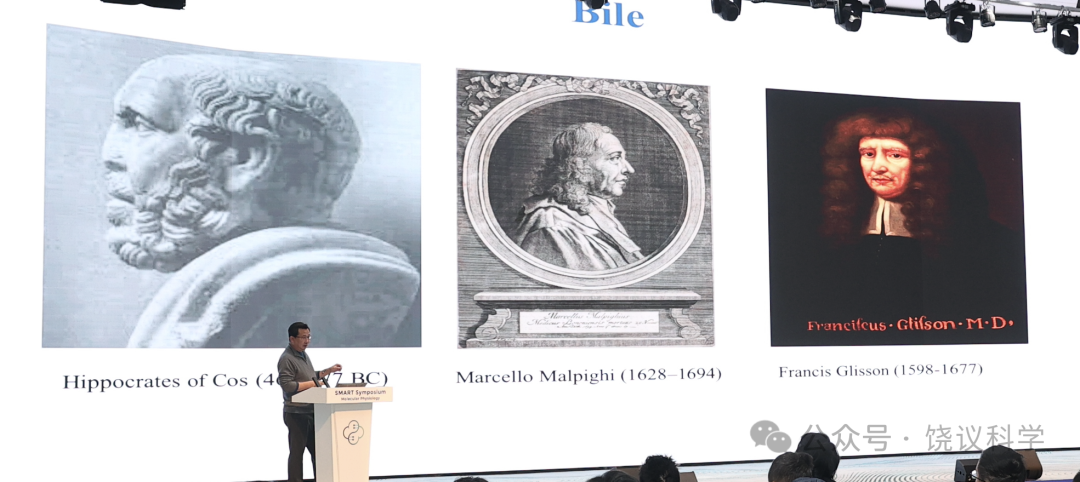
胆酸早在150年前就被发现了。但很长时间认为它们只是起糜化食物而助消化的作用。近几十年才认识到多种胆酸的作用不同,其中一部分在近年被发现是信号,可以激活细胞内的受体、或细胞膜上的GPCR(如TGR5/GPBAR1、CHRM3或MRGPRX4)。
急性胰腺炎(AP)是胃肠道住院的第二大原因,长期以来机理不明。1856年就有法国生理学家提出胆酸也许可以引起胰腺炎。1901年,美国医生进一步提出胆酸反流导致急性胰腺炎。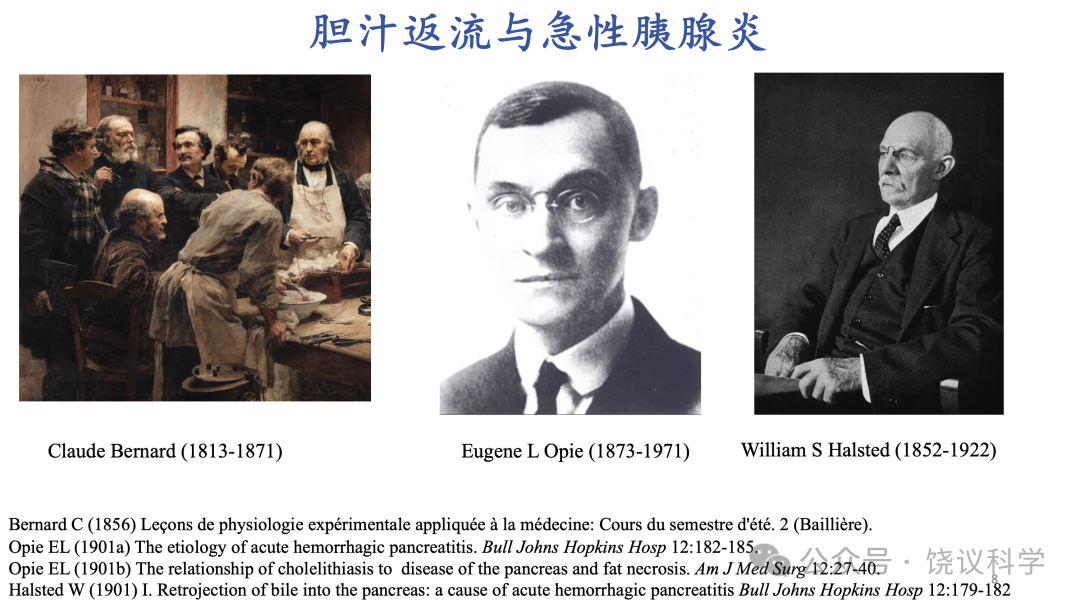
那么胆源性胰腺炎是如何发生的?
自振滔和饶毅的研究将以上三方面联系起来了。他们在给GPCR脱孤过程,发现GPR39不仅是以前有人提出的锌离子的受体,而更是一些胆汁酸的受体。进化上,GPR39先只对胆汁酸反应,以后才加上对锌离子反应,在哺乳动物胆汁酸和锌离子有协同效应。胆汁酸有多种,已经有些被发现激活GPCR,自振滔和饶毅发现部分胆汁酸可以激活GPR39。
自振滔和饶毅通过实验提出部分胆汁酸可以激活胰腺腺泡细胞膜上的GPR39,从而导致钙离子内流,过高的钙离子浓度导致腺泡细胞的死亡。如果这一概念是正确的,那么治疗急性胰腺炎就应该通过设计阻断胆汁酸刺激GPR39受体。所以,这是一个重要而长期没有解决的疾病,在机理研究上的重要进展,而又立即提示如何可以找到治疗的药物。这很可能是我国罕见的对全世界重大常见疾病提出分子机理。
自振滔和饶毅还发现,部分胆酸可以刺激胃饥饿素(Ghrelin)的受体,但他们这篇论文没有报道体重和代谢。
现代实验科学研究,众多研究人员合作比比皆是。在人类遗传学,有时作者几百人,而一般的生命科学研究,作者几位到十几位是常规。研究生自振滔与导师饶毅两人发表一篇论文属于少见。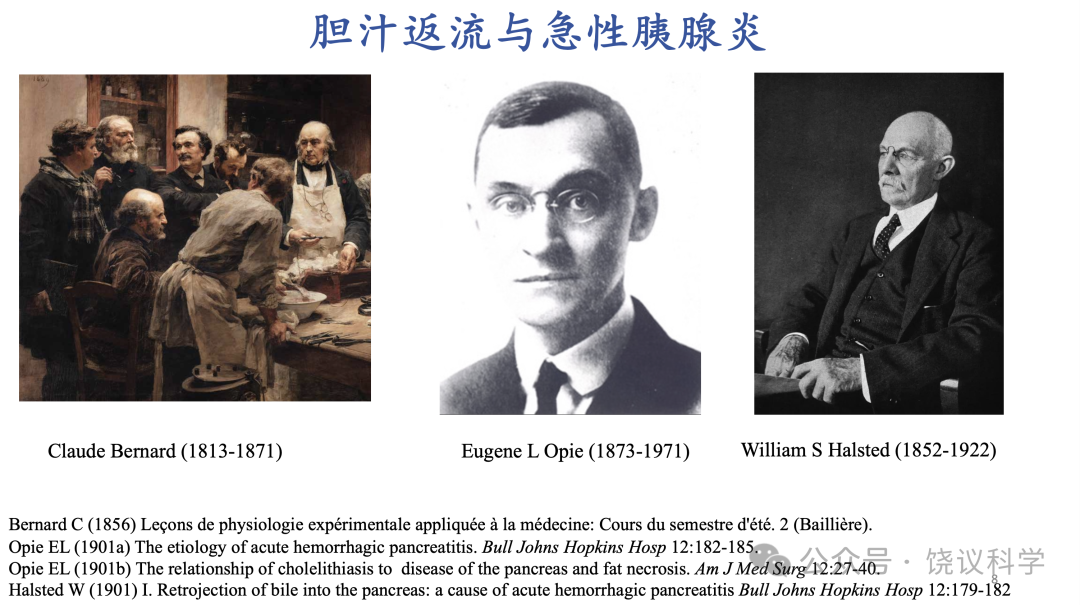
这也是罕见的在中国的研究依据新发现的机理而提出治疗重要常见疾病的药物新靶标。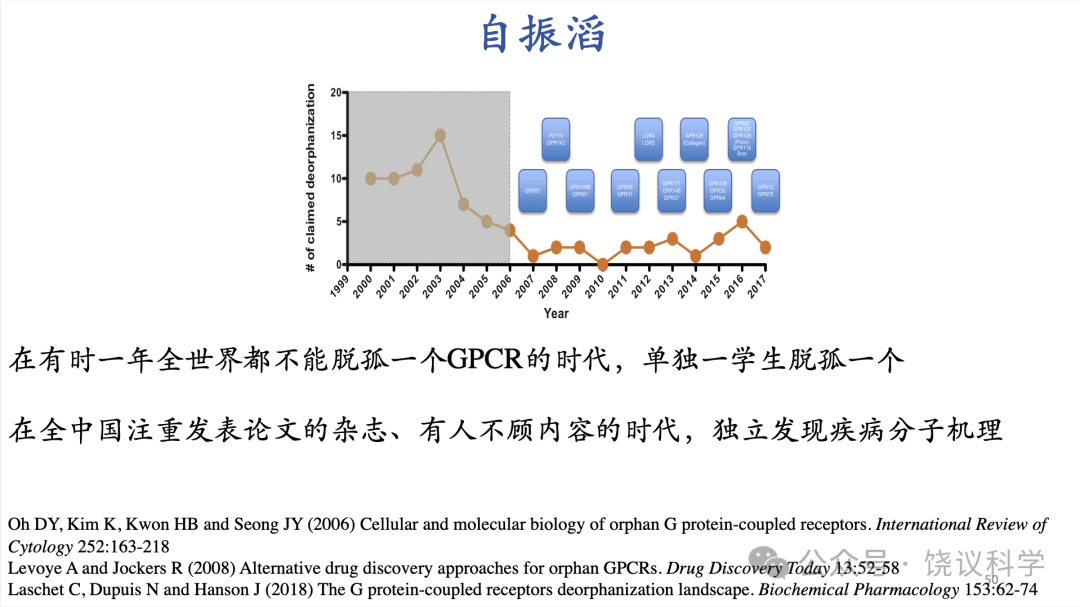
这篇论文的题目是“发现GPR39是胆酸进化上保守的受体、及其参与胆源性急性胰腺炎”,杂志为Science Advances。,下载地址:https://www.science.org/doi/10.1126/sciadv.adj0146。
摘要
急性胰腺炎 (AP) 是最常见的胃肠道疾病之一。胆酸在170年之前就被提出为AP的原因,虽然其机理迄今不清。在此,我们报道,两种GPCR受体GPR39和GHSR可以介导细胞对胆酸的反应。我们的结果揭示GPR39是胆酸(BA)的进化上保守的受体,特别是3位O硫酸化石胆酸的受体。在培养细胞中,GPR39对于BA诱导的钙离子浓度升高的反应既必需也充分。在胰腺的腺泡细胞,GPR39介导BA引起的钙离子浓度升高和细胞死亡。GPR39基因敲除的小鼠,胆酸诱导AP显著减轻。我们的发现提供了体外和体内的实验证据,显示GPR39对介导BA信号的充分和必要,提出了GPR39参与胆源性AP发病原理,提示GPR39为胆源性AP的有希望的治疗靶标。
引言
急性胰腺炎(AP)是胃肠道疾病住院的两大原因之一(Petrov and Yadav, 2019),胆结石是其最常见诱因(Forsmark,Vege and Wilcox, 2016)。 法国生理学家Claude Bernard用狗实验后最早提出胆汁诱导胰腺炎的可能性(Bernard, 1856)。 美国医生对病人观察后提出胆汁反流到胰腺是AP的原因(Halsted, 1901; Opie, 1901a, 1901b, 1904)。Opie的共同通道假说认为Vater乳突处胆结石阻碍胆汁流入十二只肠,导致胆汁返流到胰腺,引起AP。此后有更多支持胆汁返流假说(Acosta and Ledesma, 1974; Lee et al., 1992; Peracchia et al., 1985; Ros et al., 1991),今天仍为主要假说之一(Pallagi et al., 2020; Petrov and Yadav, 2019)。目前认为容易受病理刺激的胰腺外分泌的腺泡细胞受损启动AP,胆源性AP由胆酸(BA)所致。
胆酸是肝内胆固醇合成的两亲固醇类。分泌输送到小肠后,原胆酸可以由肠道细菌代谢为次胆酸(Wahlstrom et al., 2016)。 因其去垢剂特点,小肠的BA促进脂溶性营养如脂肪和亲脂性维生素的小孩和吸收(Copple and Li, 2016)。但传统认为胆酸只能以物理化学特性作为表面物质包埋营养物、促进其吸收的观点被挑战(Hofmann and Hagey, 2014; Kawamata et al., 2003; Makishima et al., 2002; Makishima et al., 1999; Maruyama et al., 2002; Parks et al., 1999)。胆酸被提出为生物学活性的信号甚至激素,它们可以激活核受体(Makishima et al., 2002; Makishima et al., 1999; Parks et al., 1999; Wang et al., 1999) 或细胞膜上的 GPCRs (Kawamata et al., 2003; Maruyama et al., 2002)。特定的胆酸可以作为激素通过GPCR或核受体调节代谢通路(de Aguiar Vallim et al., 2013; Molinaro et al., 2018; Thomas et al., 2008; Wahlstrom et al., 2016)。 通过受体作用的BAs对于糖尿病 (Thomas et al., 2009) 或非酒精性脂肪肝潜在有治疗意义(Adorini et al., 2012)。
胆酸可以直接损害胰腺腺泡细胞,以钙依赖的方式(Orabi et al., 2013;Saluja et al., 2019)。Taurolithocholic acid 3-sulfate (TLCAS)是1967 年通过薄层层析发现的由石胆酸(LCA)来的次生胆酸(Palmer,1967)。TLCAS可以刺激腺泡细胞钙离子浓度 (Ca2+) 升高(Gerasimenko et al., 2006; Kim et al., 2002; Voronina et al., 2002), 分泌淀粉酶(Perides et al., 2010a), 去极化膜电位 (Voronina et al., 2005), 激活酶原(Muili et al., 2013b; Perides et al., 2010a), 线粒体功能缺陷(Voronina et al., 2004), 细胞损失和死亡(Louhimo et al., 2016; Muili et al., 2013a; Muili et al., 2013b)。低浓度TLCAS 触发分离腺泡细胞钙升高,而高浓度TLCAS引起钙离子长期升高,被认为是AP的病因(Perides et al., 2010a; Voronina et al., 2002)。因此,TLCAS参与AP意味着找到TLCAS在胰腺腺泡细胞的受体很重要。
GPCRs是细胞交流最大家系的跨膜蛋白。GPCRs是最偏好的药物靶点,约130 种GPCR是美国药监局批准药物的~35% (Hauser et al., 2017)。多于一百个GPCRs没有配体(Davenport et al., 2013; Foord et al., 2005)。这些“孤儿” GPCRs 分布于全身 (Ehrlich et al., 2018; Regard et al., 2008), 占非感觉GPCR的~17% (Alexander et al., 2017)。找到GPCRs的配体对于理解生理、揭示病理、发现药物都很重要(Rask-Andersen et al., 2014; Sriram and Insel, 2018; Wise et al., 2004)。
GPR39偶联 Gαq, 属于胃饥饿素亚家族(Kojima and Kangawa,2005)。它高度表达在胃肠道、肝和胰腺(Egerod et al.,2005;Moechars et al., 2006),参与调节胃肠道运动、胆固醇代谢(Moechars et al., 2006)、上皮完整性(Cohen et al., 2014)和血管新生(Meda Venkata et al., 2023)。已知锌离子(Zn2+)可以激活GPR39(Yasuda et al.,2007;Holst et al., 2004,2007),但不清楚是否还有其他内源配体。
我们现在提供证据,GPR39是胆酸的一种新受体,特别是3-O硫酸化石胆酸的。GPR39确实为胰腺腺泡细胞膜上TLCAS的受体。遗传剔除小鼠GPR39基因减轻BA诱导的AP造成的胰腺损失。我们的结果还显示鱼的GPR39、以及GHSR都只对胆酸反应、而不对锌离子反应,提示GPR39在进化上首先对胆酸反应,而在哺乳动物才也对锌离子反应。我们因此发现了胆酸的新受体,确立了GPR的重要作用,提示了潜在治疗胆源性AP的新靶点。
结果
TLCAS 激活GPR39
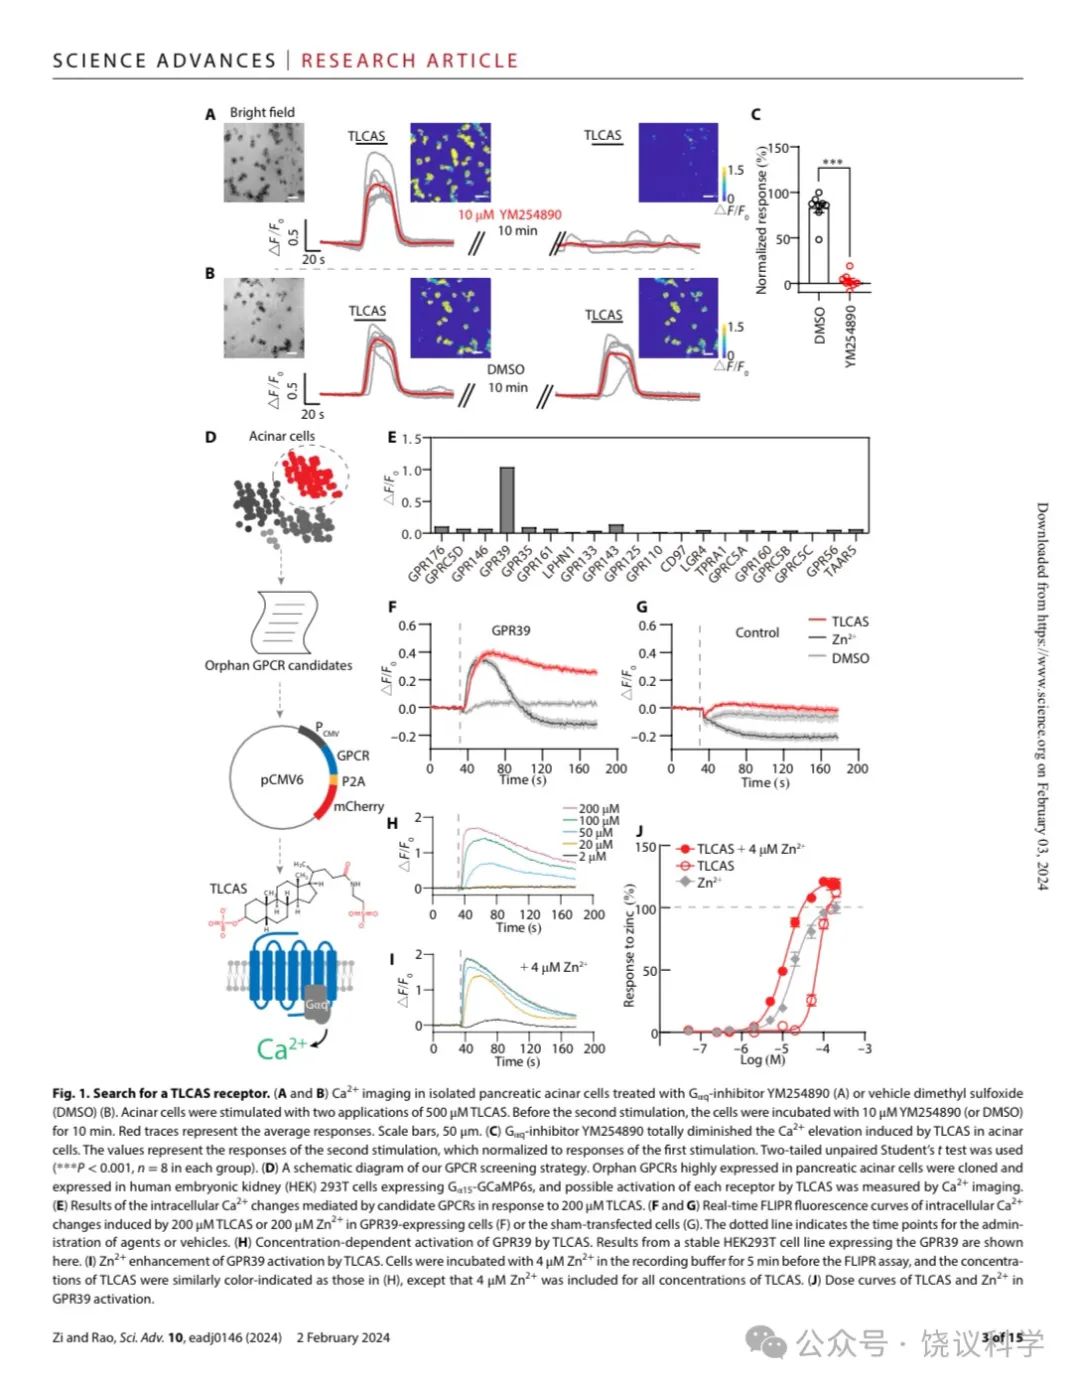
TLCAS(Taurolithocholic Acid 3-Sulfate)诱导胰腺腺泡细胞钙离子浓度升高的钙来自内质网(ER),依赖IP3R(Voronina et al., 2002;Gerasimenko et al., 2006)。用Gαq的抑制剂YM254890 (Campbell and Smrcka, 2018)处理腺泡细胞后, TLCAS不再引起钙浓度升高(图1A到1C)。
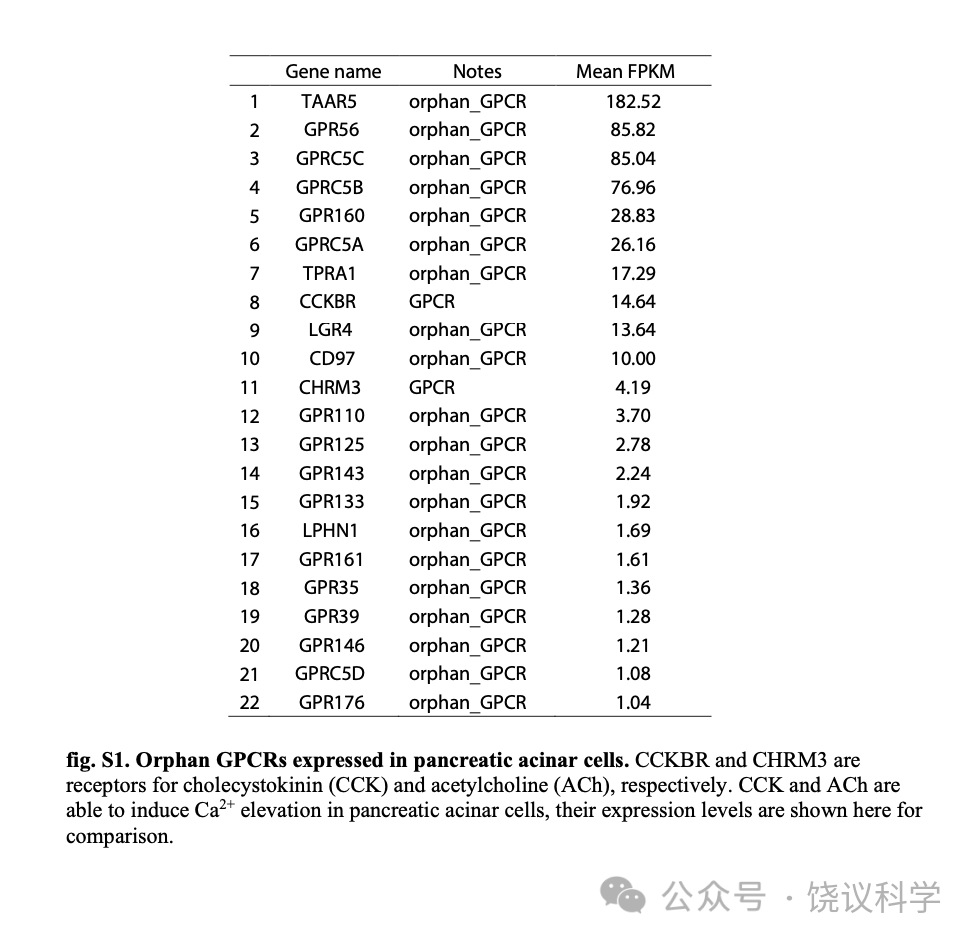
如图1D所示,为了寻找介导TLCAS引起胰腺腺泡细胞内钙升高的GPCR,我们分析了其他课题组已经发表的人的胰腺的单分子RNA测序资料(ArrayExpress, E-MTAB-5061) (Segerstolpe et al., 2016),由此我们得到一个单子显示在腺泡细胞高度表达的GPCR (酶百万每千转录本片段,FPKM) 大于1,得到二十个孤儿GPCRs (附图S1)。为了研究其中是否有介导TLCAS细胞反应的GPCR,我们一个一个把这20个GPCR的cDNA转染到表达Gα15和GCaMP6s的人胚肾(HEK)293T细胞。细胞对200微摩尔TLCAS的反应由共聚焦显微镜检测细胞内钙离子浓度来确定。我们发现转染了GPR39的HEK293T细胞对TLCAS有稳定的反应(图1E)。TLCAS不能通过以下19给GPCR中任何一个刺激细胞内钙离子浓度升高:GPR176, GPRC5D, GPR146, GPR35, GPR161, LPHN1, GPR133, GPR143, GPR125, GPR110, CD97, LGR4, TPRA1, GPRC5A, GPR160, GPRC5B, GPRC5C, GPR56 或 TAAR5。
GPR39以前被认为是Zn2+的受体(Holst et al., 2007; Holst et al., 2004; Yasuda et al., 2007)。我用钙离子成像比较细胞对TLCAS和Zn2+的反应(图1F)。200 μM TLCAS和200 μM Zn2+ 都可以分别引起转染了GPR39的细胞内Ca2+浓度升高(图1F), 而假转染的HEK293T细胞对 TLCAS和Zn2+ 都没有反应(图1G)。对TLCAS 反应的时程延续长于对Zn2+的反应(Figure 1C)。
我们建立了稳定表达GPR39的HEK293T细胞系(如果不另外指出,就是小鼠的GPR39)。GPR39被TLCAS以剂量依赖的模式所激活(图1H和1J)。以前研究显示Zn2+ 对合成的外源激动剂有正向别构效应(Frimurer et al., 2017; Peukert et al., 2014)。我们检测Zn2+对TLCAS激活 GPR39的作用。结果显示Zn2+ 增加GPR39介导的TLCAS的钙反应, 4 mM Zn2+存在时量效曲线左移(图1I 和1J)。
特定胆酸作为GPR39激动剂
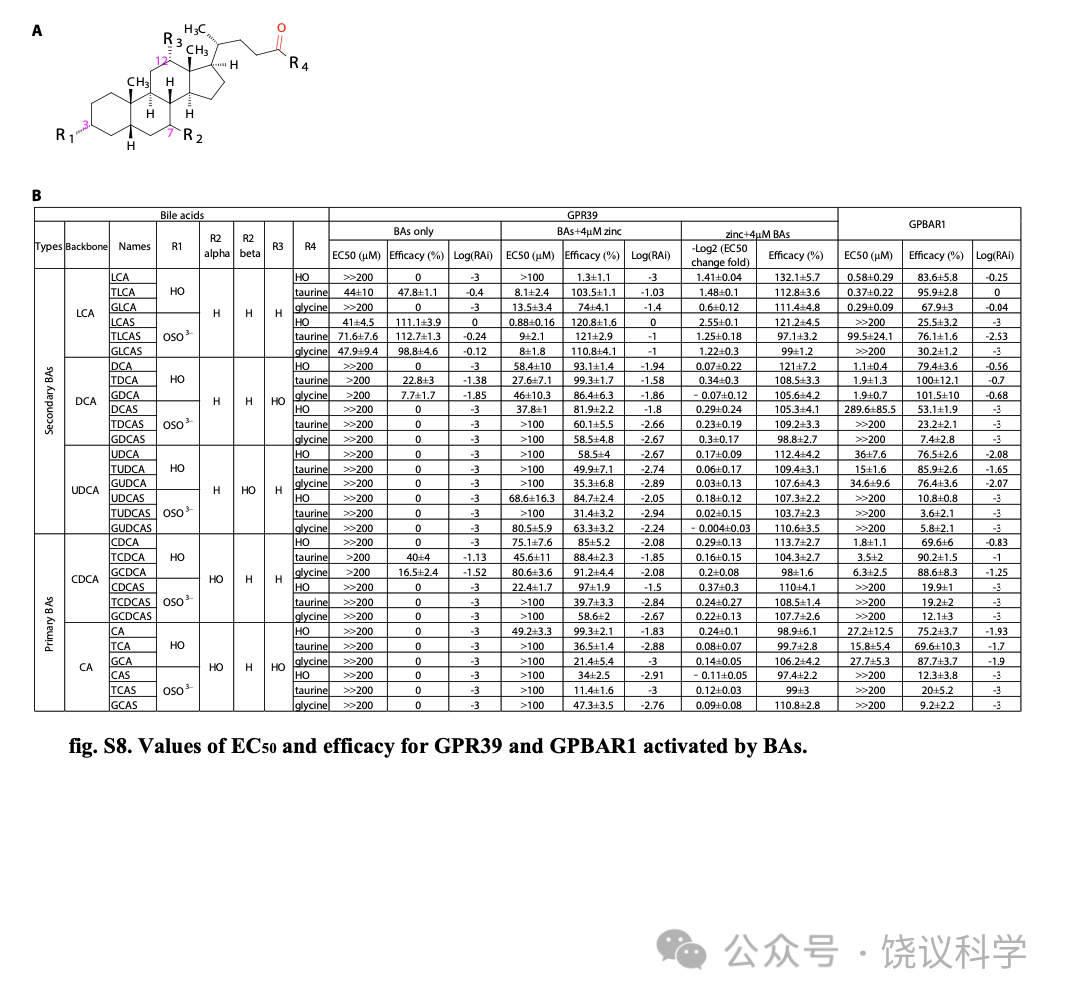
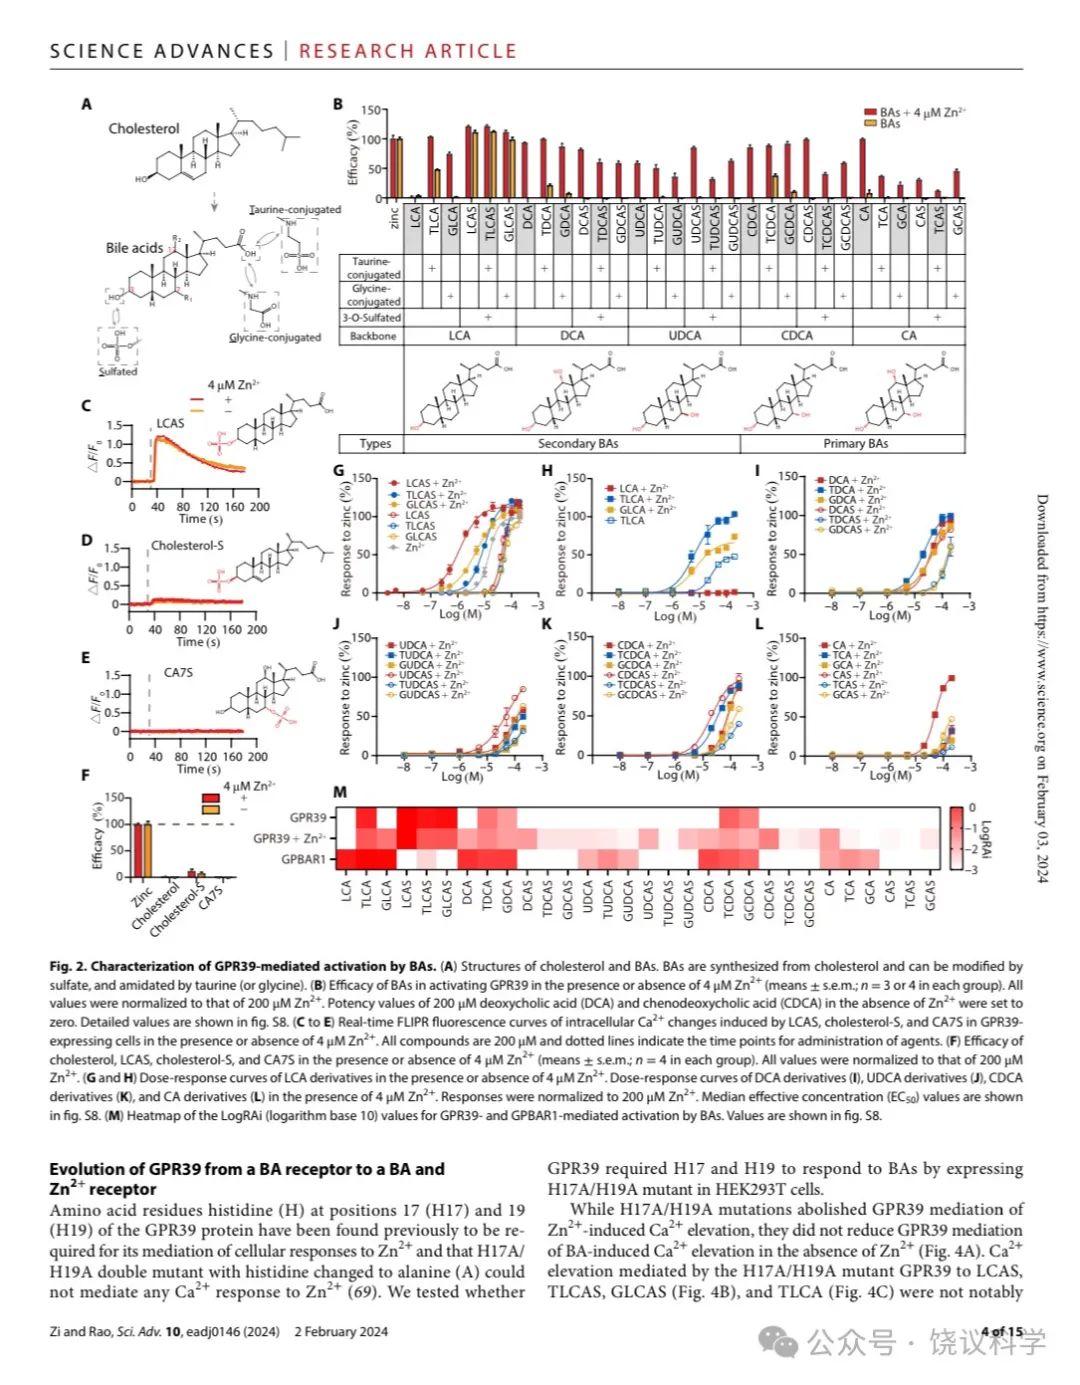
胆酸都有类似的分子骨架(图2A)。为研究不同胆酸对GPR39的激活,我们分别检测了30种胆酸分子 (图2B),既有初级胆酸、也有次级胆酸如cholic acid (CA), chenodeoxycholic acid (CDCA), ursodeoxycholic acid (UDCA), deoxycholic acid (DCA) and LCA,及其硫酸化和/或酰胺化衍生物。
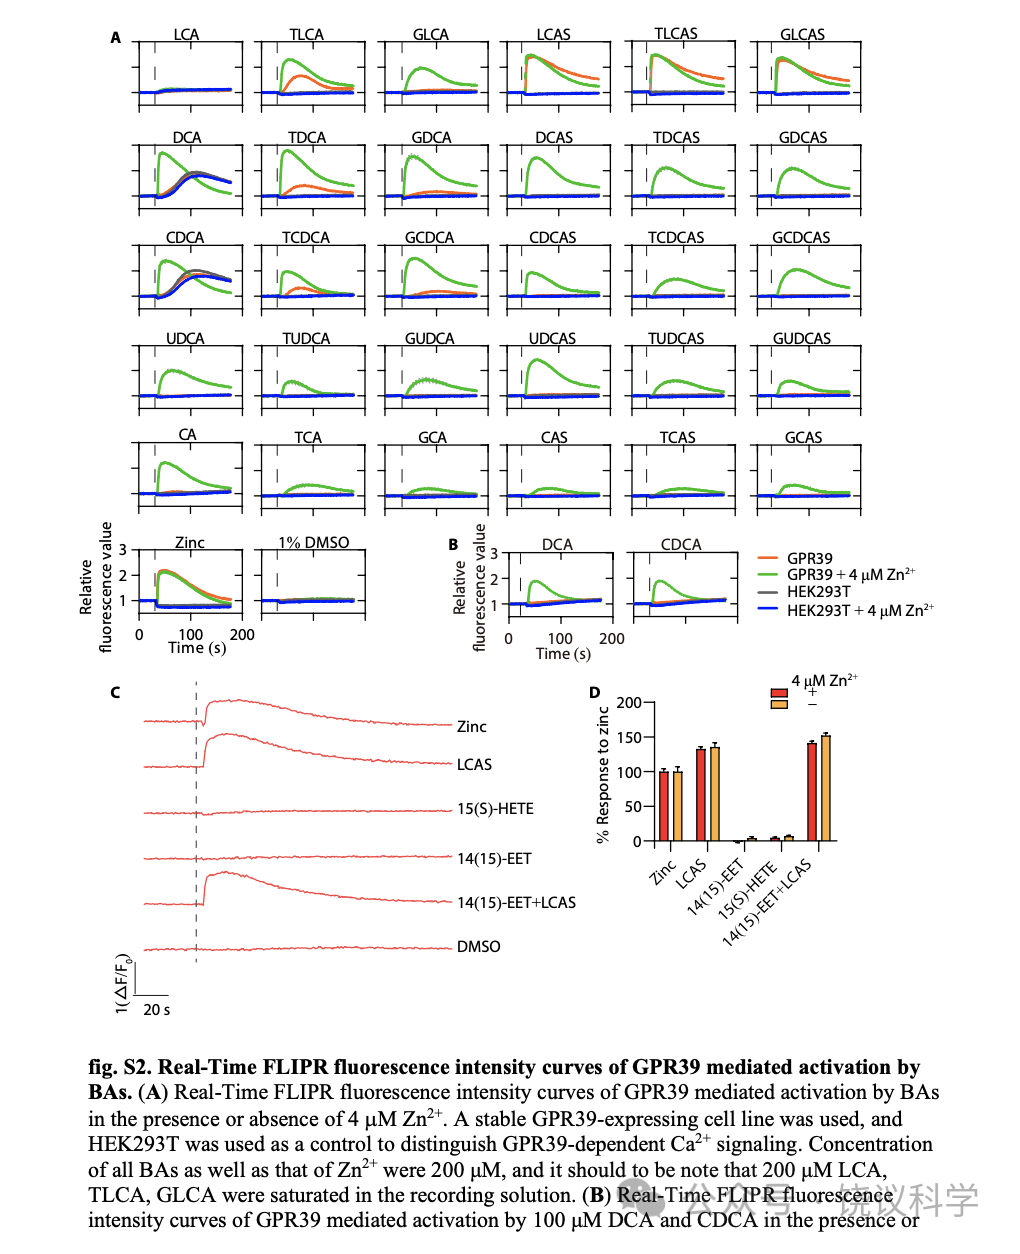
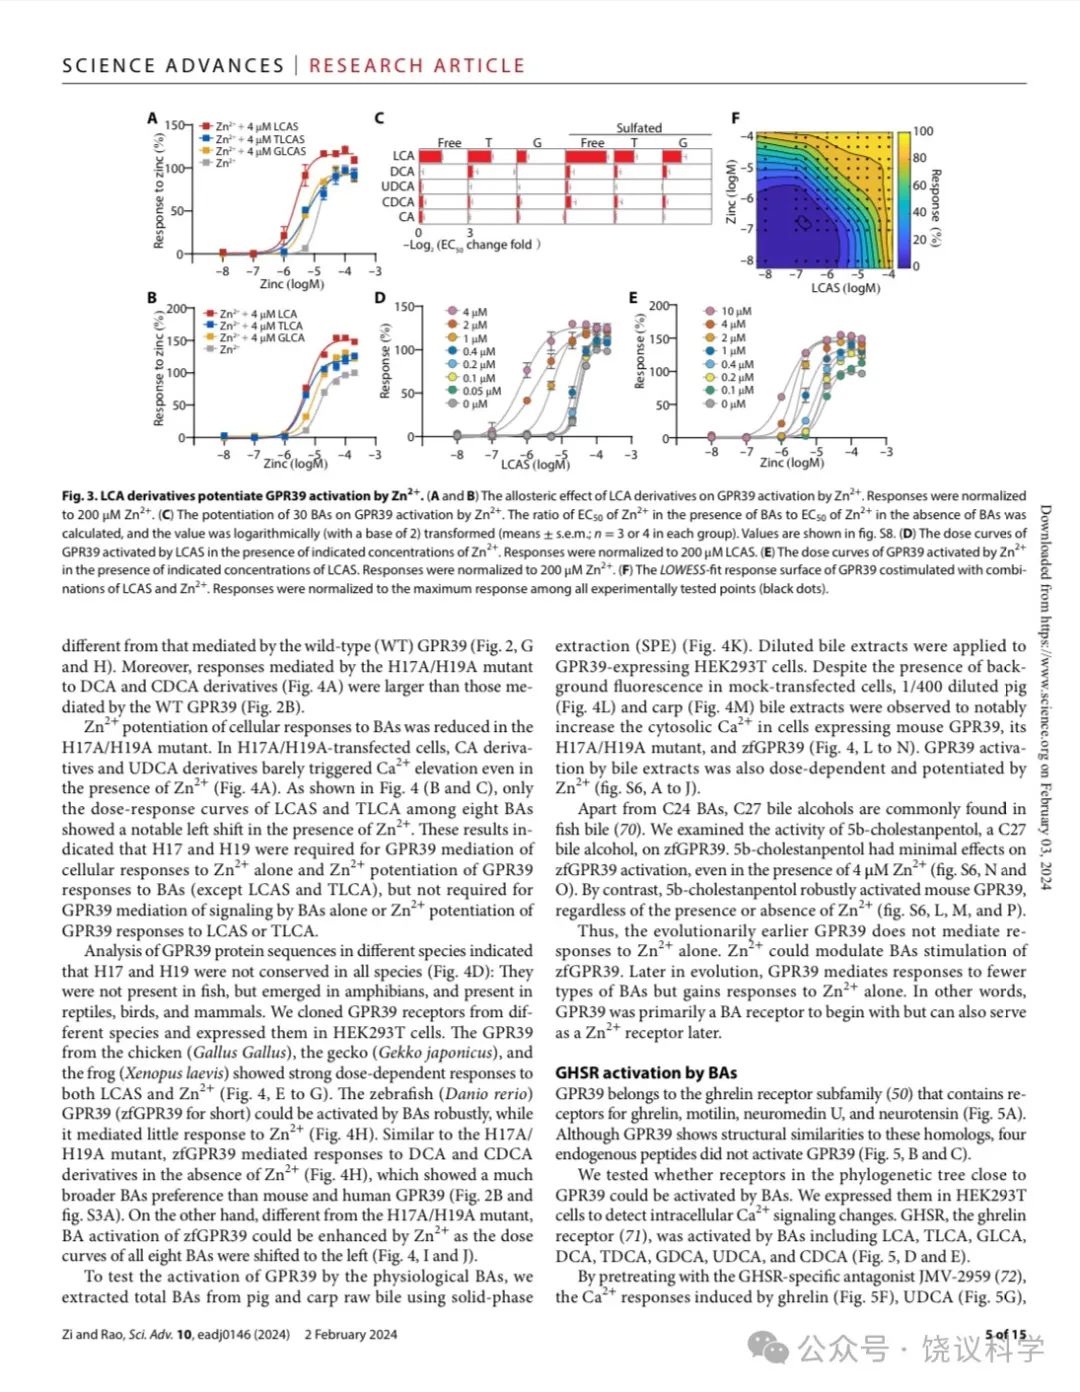
没有Zn2+时,三种3-O-硫酸化LCAs (TLCAS, glycolithocholic acid 3-sulfate (GLCAS)和 lithocholic acid 3-sulfate (LCAS))显著激活GPR39 (图2B, 2G和附图S2A),以LCAS为最强 (图2C和2G)。在低一些的程度, taurolithocholic acid (TLCA), tauro/glyco-deoxycholic acid (T/G-DCA) 和 tauro/glyco-chenodeoxycholic acid (T/G-CDCA) 也能在无Zn2+时激活 GPR39 (图2B, 2H和附图S2A)。
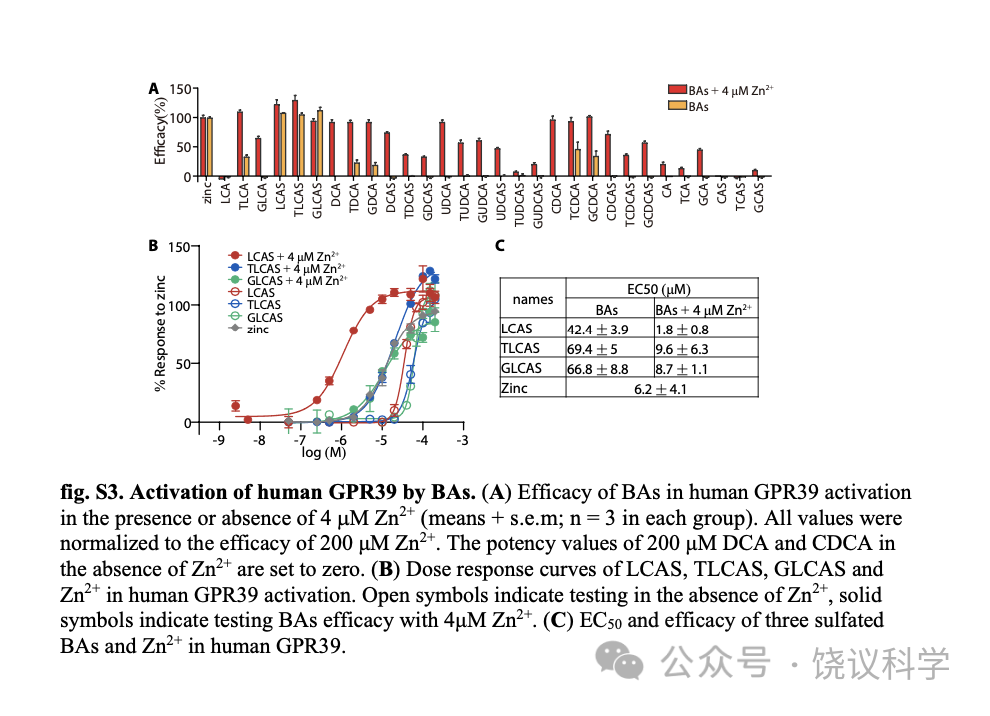
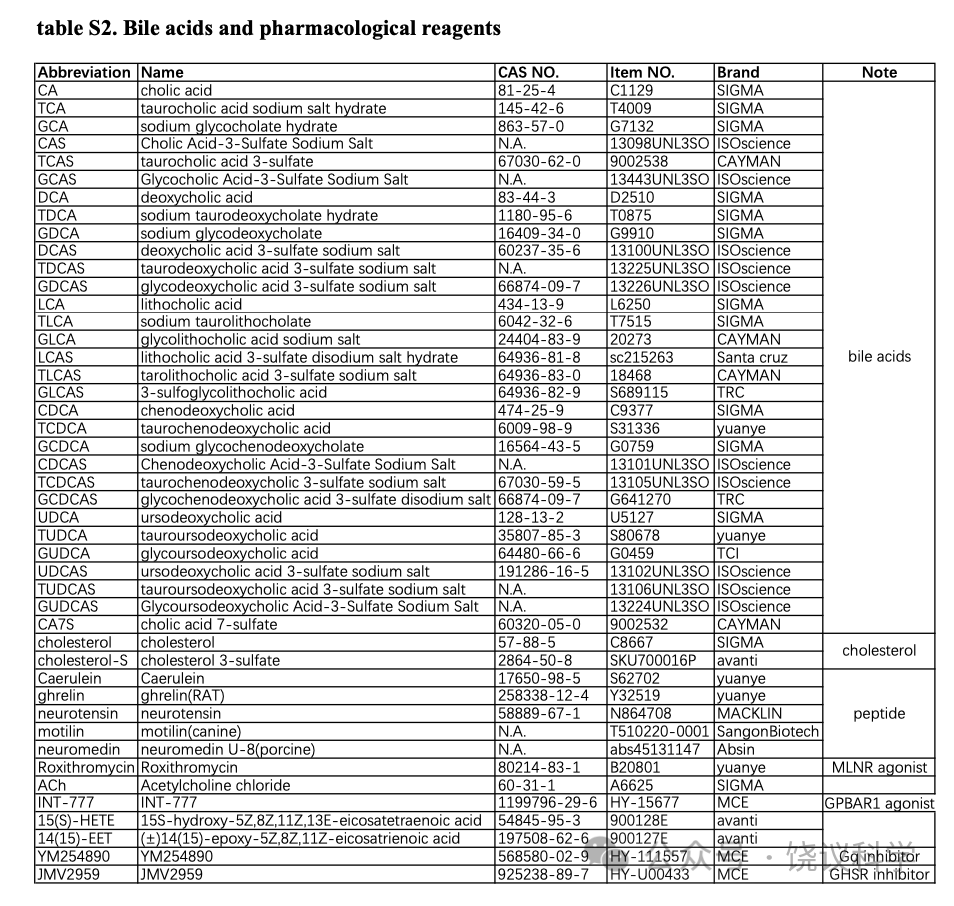
4 μM Zn2+存在时,除LCA之外所有胆酸都能激活GPR39 (图2B和附图 S2A)。LCAS、TLCAS、GLCAS在Zn2+存在时仍然激活最强,而CA衍生的但是作用较弱(图2G到2L)。人的GPR39(附图S3)的胆酸激活谱类似小鼠的(图2B)。虽然结构上类似于3-O-硫酸化LCAs, 胆固醇(图2F)、cholesterol-S (图2D 和2F) 以及cholic acid 7-sulfate (CA7S) (图2E和2F) 不能激活GPR39,即使有4 μM Zn2+存在时也不能。虽然最近有一篇报道GPR39可以被15(S)-hydroxyeicosatetraenoic acid (HETE)激活、被14(15)-epoxyeicosatrienoic acid (EET)阻断(Alkayed et al., 2022),我们既没有观察到15(S)-HETE激活GPR39,也没有观察到14(15)-EET阻断GPR39(附图S2C和S2D)。
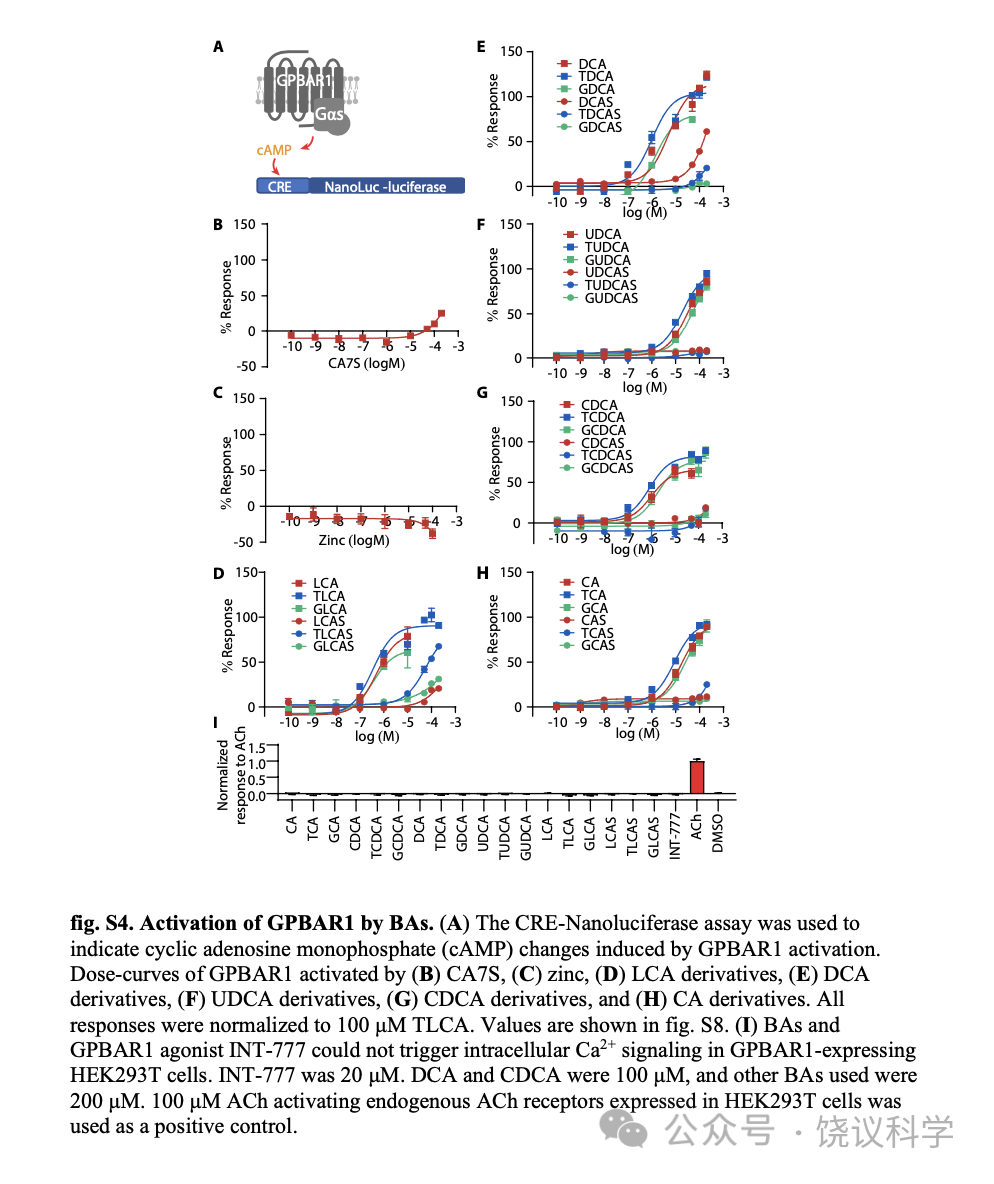
GPBAR1(也称为TGR5或M-BAR)是最研究的胆酸细胞膜受体,报道为Gas偶联 (Kawamata et al., 2003; Maruyama et al., 2002)。为比较胆酸对GPBAR1和GPR39的激活,我们用CRE-荧光酶素(附图S4A)测定细胞内环腺苷酸(cAMP)的方法(Yu et al., 2019),检测了全部30种BA对GPBAR1的激活。GPBAR1可以被特定BA所激活 (附图S4D到S4H),但不能被Zn2+所激活(附图S4C)。Gαs偶联的GPBAR1不能介导细胞内钙升高 (图S4I)。我们比较30种胆酸Emax/EC50 相对值(RAi,相对内在活性) (Inoue et al., 2019)。如LogRAi 图(图2M)所示, 胆酸的GPR39激活谱不同于胆酸的GPBAR1激活谱。LCA、DCA及其T/G共轭物强烈激活GPBAR1, 而3-O-硫酸化显著降低胆酸对GPBAR1的激活能力 (图2M,附图S4D和S4E) (Sato et al., 2008)。虽然GPR39和GPBAR1都偏好LCA有关胆酸,GPBAR1几乎不对 三种3-O-硫酸化LCAs 起反应,而后者是GPR39的强烈激动剂。我们的结果提示3-O-硫酸化将LCA及其T/G共轭物的偏好从BPBAR1改变成为GPR39。另外, CA7S, 一种不能激活GPR39的7-O-硫酸化的BA (图2E),最近被报道强烈GPBAR1 (Chaudhari et al., 2021), 但我们没有观察到(附图S4B)。
胆酸与Zn2+相互促进对GPR39的激活
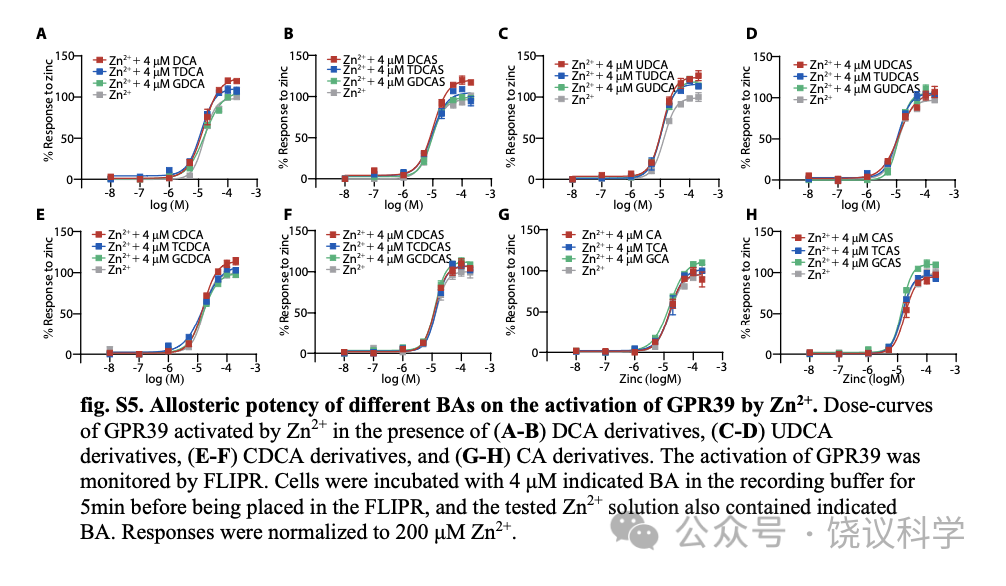
Zn2+促进多数胆酸对GPR39的激活 (图2B), 我们检查胆酸是否促进Zn2+对GPR39的激活。我们测了在单个胆酸存在的情况下,Zn2+对GPR39的激活, 发现只有LCA及其衍生物如LCA、LCAS及其T/G 共轭物, 促进Zn2+对GPR39的激活(图3A至3C), 以LCAS最有效 (图3C)。其他胆酸 (图3及附图S5A至S5H), 不能显著提高Zn2+对GPR39的激活。
我们用的4 μM Zn2+浓度远高于血清游离Zn2+浓度(0.09-0.42 nM) (Alker et al., 2019),但稍低于血清锌的总浓度(9-18μM) (Barman et al., 2020)。为进一步定量LCAS和Zn2+相互促进GPR39激活,我们分析了不同浓度Zn2+与LCAS之间的协同效应。. Activation of GPR39 by LCAS was significantly shifted by at concentrations above 1 μM以上的Zn2+显著移动LCAS激活GPR39,反之亦然 (图3D和3E)。低浓度的配体在LCAS和Zn2+存在时可以激活GPR39, LCAS与Zn2+ 的相互促进使GPR39的动力范围更广(图3F)。
GPR39从胆酸受体演化成为胆酸和Zn2+受体
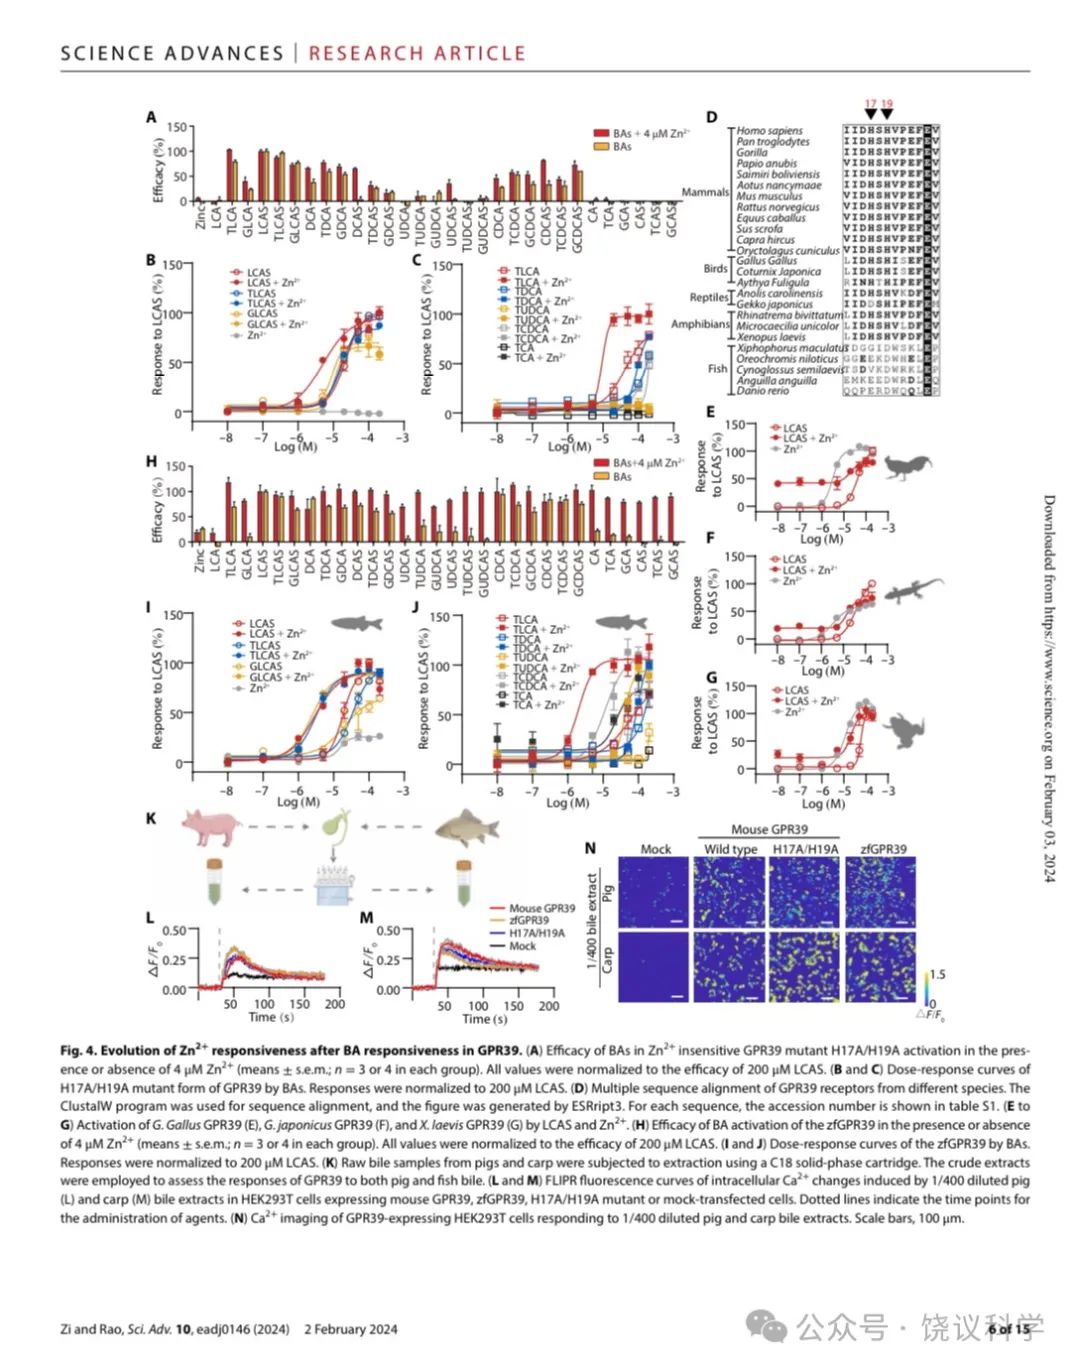
以前已经发现GPR39蛋白质的第17位(H17)和 19位(H19)氨基酸残基组氨酸 (H) 对于GPR39介导细胞对Zn2+所必需, H变成丙氨酸(A) 的H17A/H19A双突变种完全不能介导Zn2+引起的细胞内Ca2+升高反应(Storjohann et al., 2008)。我们通过在HEK293细胞表达H17A/H19A突变种来检测GPR39是否需要H17和H19才能对胆酸反应。
虽然H17A/H19A突变消除了GPR39介导的Zn2+诱导的Ca2+上升,它们不能减少GPR39介导胆酸引起的、没有存在时的Ca2+上升(图4A)。LCAS、TLCAS、GLCAS(图4B)和TLCA(图4C)通过H17A/H19A突变的GPR39引起的Ca2+ 上升与野生型 (wt) GPR39没有显著差别 (图2G与2H)。而且H17A/H19A突变介导对DCA和CDCA衍生物的反应(图4A)大于野生型GPR39 (图2B)。
Zn2+增强细胞对胆酸反应被H17A/H19A突变减弱。在H17A/H19A转染的细胞,CA衍生物和UDCA衍生物几乎不能触发Ca2+升高,即使有Zn2+存在时 (图4A)。如图4B与4C所示,八种胆酸中仅LCAS和TLCA的量效曲线在Zn2+存在时显示显著左移。这些结果说明H17和H19对于GPR39 介导的细胞对Zn2+本身以及Zn2+ 增强 GPR39对胆酸反应是必需的 (除外LCAS和TLCA),而对GPR39介导胆酸本身的反应、或Zn2+ 增强 GPR39对LCAS和TLCA反应却不是必需的。
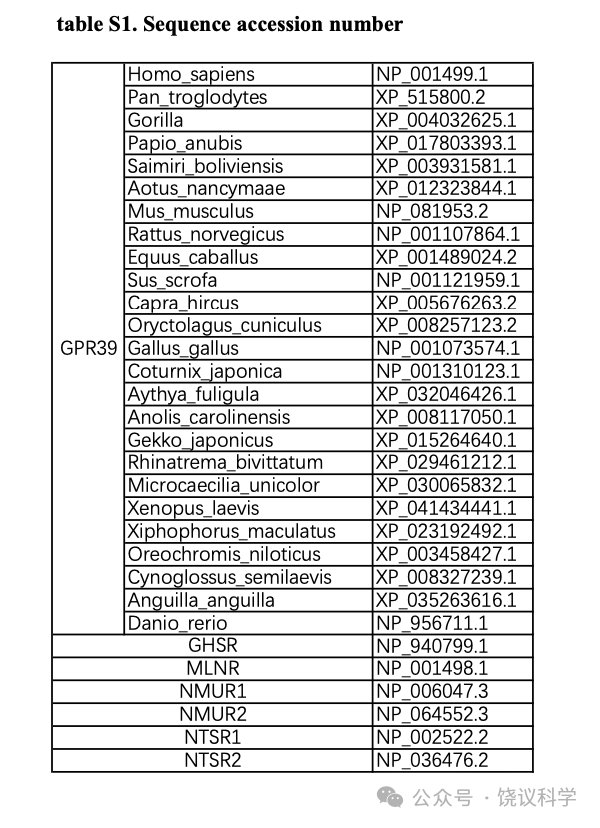
分析不同种属GPR39蛋白质序列显示H17与H19并没有在所有种属里面保守 (图4D):它们不在鱼中存在,而是在两栖类出现,在爬行、鸟类和哺乳类存在。我们克隆了鸡 (Gallus Gallus)、壁虎(Gekko japonicus)和蛙(Xenopus laevis) 的GPR39,将其表达在HEK293T细胞,它们都介导对LCAS和Zn2+的剂量依赖的反应 (图4E至4G)。斑马鱼 (Danio rerio) 的GPR39 (zfGPR39)可以被胆酸所激活,但对Zn2+反应很小(图4H)。类似于H17A/H19A突变,zfGPR39在Zn2+不存在时介导地DCA与CDCA衍生物的反应 (图4H),而且介导对更广谱胆酸的反应 (图2B与附图S3A)。不同于H17A/H19A突变,八种胆酸引起zfGPR39的反应都可以被Zn2+ 左移(图4I与4J)。
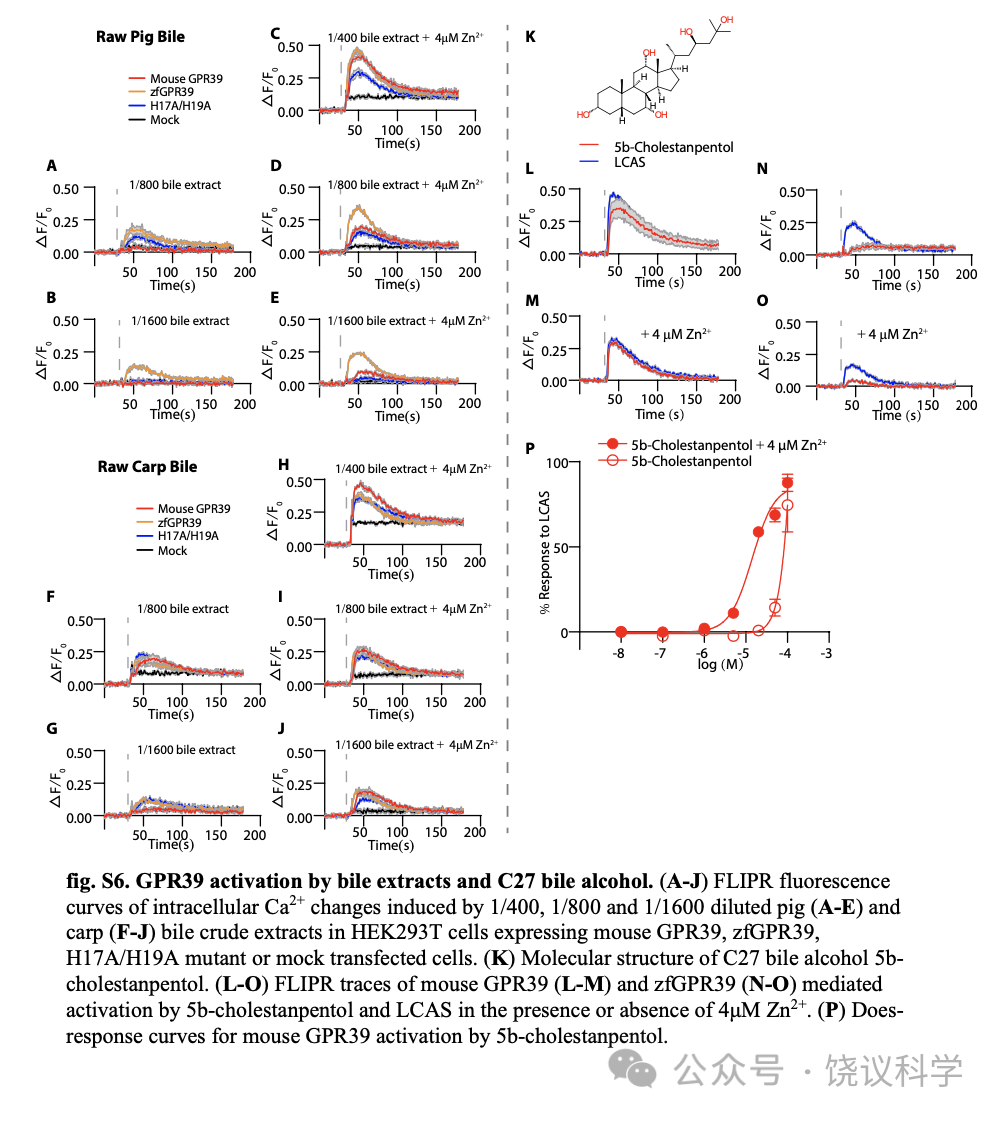
为检测生理胆酸激活GPR39,我们从猪和鲤鱼粗提胆酸(图4K) 。稀释的胆酸提取物施于表达GPR39的HEK293T细胞。虽然模拟转染的细胞有荧光背景,1/400稀释的猪胆酸(图4L)和鲤鱼胆酸(图4M)被观察到可以显著增加表达鼠GPR39、其H17A/H19A突变和zfGPR39的细胞浆的Ca2+(图4L至4N)。提取物对GPR39的作用也呈浓度依赖、可以被Zn2+增强(附图S6A与S6J)。
C24胆酸之外,C27胆酸也普遍在鱼胆酸中发现(Hofmann et al., 2010)。我们检测了5b-cholestanpentol对zfGPR39的作用。它对zfGPR39作用很小,即使有4 μM Zn2+ (附图S6N与S6O)也一样。而5b-cholestanpentol可以很好地激活小鼠GPR39,无论是否有Zn2+存在(附图S6L、S6M与S6P)。
因此,进化早的GPR39不介导对单独Zn2+本身的反应。Zn2+可以调节胆酸对zfGPR39的刺激。进化到后来,GPR39对更少种类的胆酸反应,而获得对单独Zn2+的反应。也就是说,GPR39开始主要是胆酸受体,以后再也能够是Zn2+受体。
胆酸激活GHSR
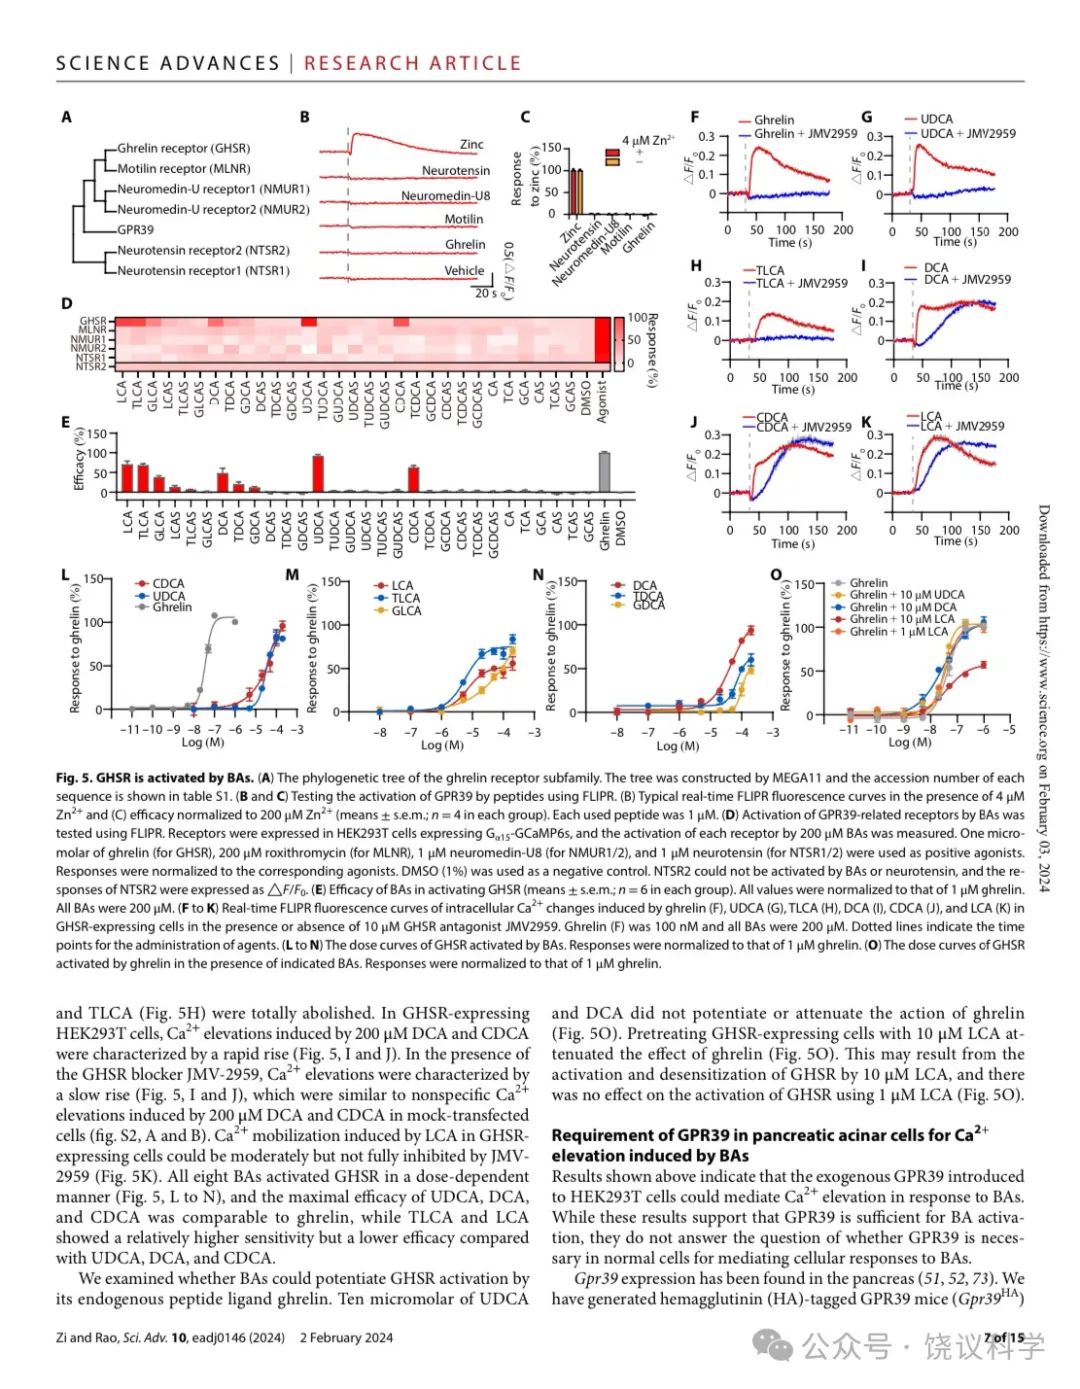
GPR39属于胃饥饿素受体亚家族(Kojima and Kangawa, 2005),包括胃饥饿素、motilin、neuromedin U和neurotensin的受体(图5A)。虽然GPR39与它们有序列相似性,这四个内源肽不能激活GPR39(图5B与5C)。
我们检测进化树上接近GPR39的受体中是否还有可以被胆酸激活的。我们将其表达在HEK293T细胞,监测Ca2+信号变化。胃饥饿素受体GHSR(Kojima et al., 1999)可以被胆酸激活,包括LCA、TLCA、GLCA、DCA、TDCA、GDCA、UDCA和CDCA(图5D与5E)。
先用GHSR特异拮抗剂JMV-2959(Moulin et al., 1999)处理后,无论是胃饥饿素(图5F)、还是UDCA(图5G)或TLCA(图5H)引起的Ca2+反应都被完全阻断。在表达GHSR的HEK293T细胞中,200 μM DCA或CDCA引起的Ca2+升高有很快上升的特征(图5I与5J)。在GHSR阻断剂JMV-2959存在的情况下,Ca2+升高很慢(图5I与5J),类似于细胞没有转染GHSR时50 μM DCA或CDCA引起的非特异的Ca2+升高(附图S2A与S2B)。LCA引起的GHSR表达细胞的Ca2+动员可以被JMV-2959部分阻断,而不能全部阻断(图5K)。所检测的8种胆酸都能剂量依赖地激活GHSR(图5L至5N),UDCA、DCA和CDCA的最大效应与胃饥饿素可比,而TLCA和LCA敏感性高于、但效应低于UDCA、DCA和CDCA。
我们检查胆酸能否增强GHSR被其内源肽配体胃饥饿素所激活。10 μM UDCA或DCA不能增强或降低胃饥饿素的作用(图5O)。先用10 μM LCA除了GHSR表达从细胞可以降低胃饥饿素的作用(图5O)。这可能是因为10 μM LCA导致GHSR激活和脱敏,而1 μM LCA不影响GHSR的激活(图5O)。
胆酸诱导胰腺腺泡细胞Ca2+升高必需GPR39
以上结果显示引入HEK293T细胞的外源GPR39可以介导胆酸引起的Ca2+ 升高。这些结果支持GPR39对于胆酸激活作用是充分的,但不能回答是否GPR39在正常细胞介导胆酸引起的细胞反应。
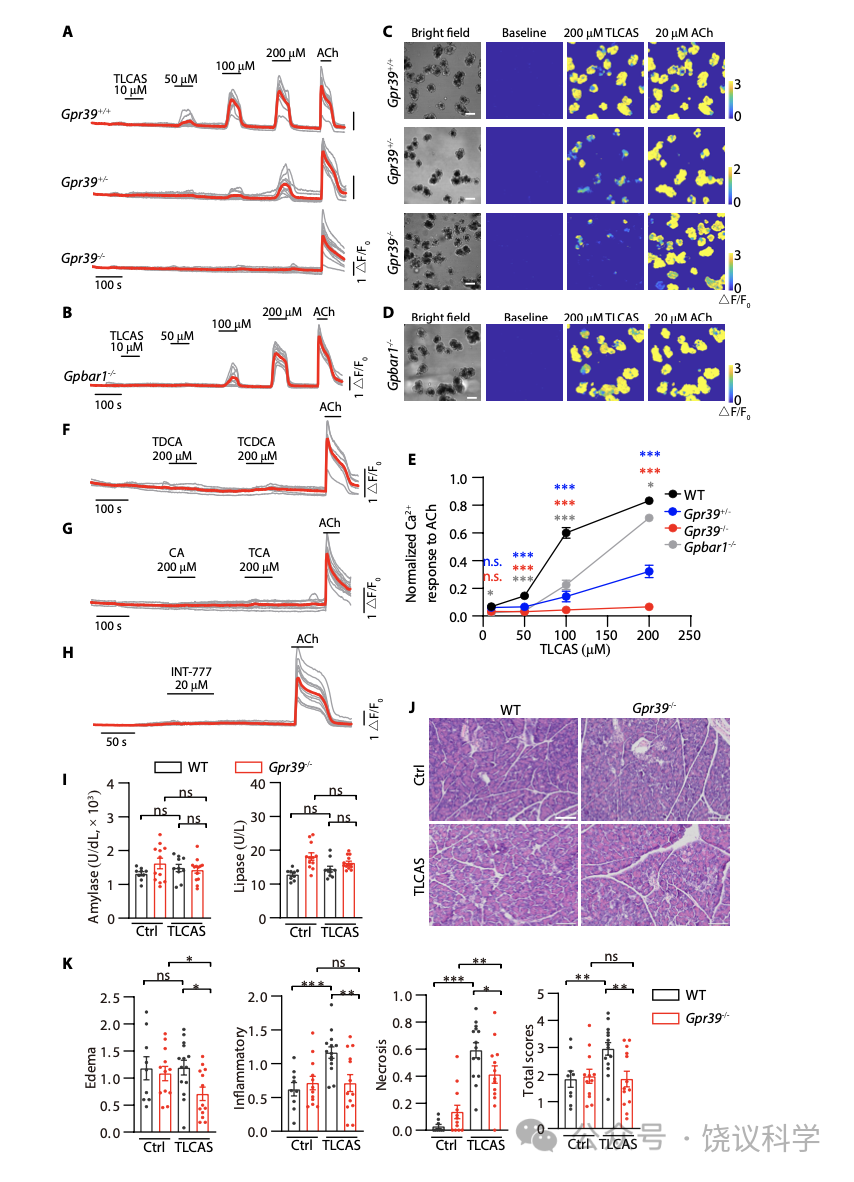
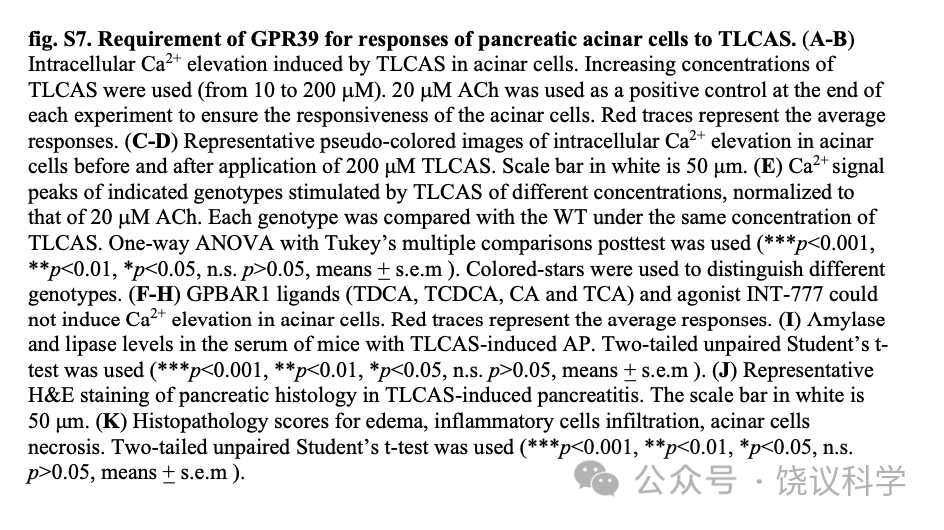
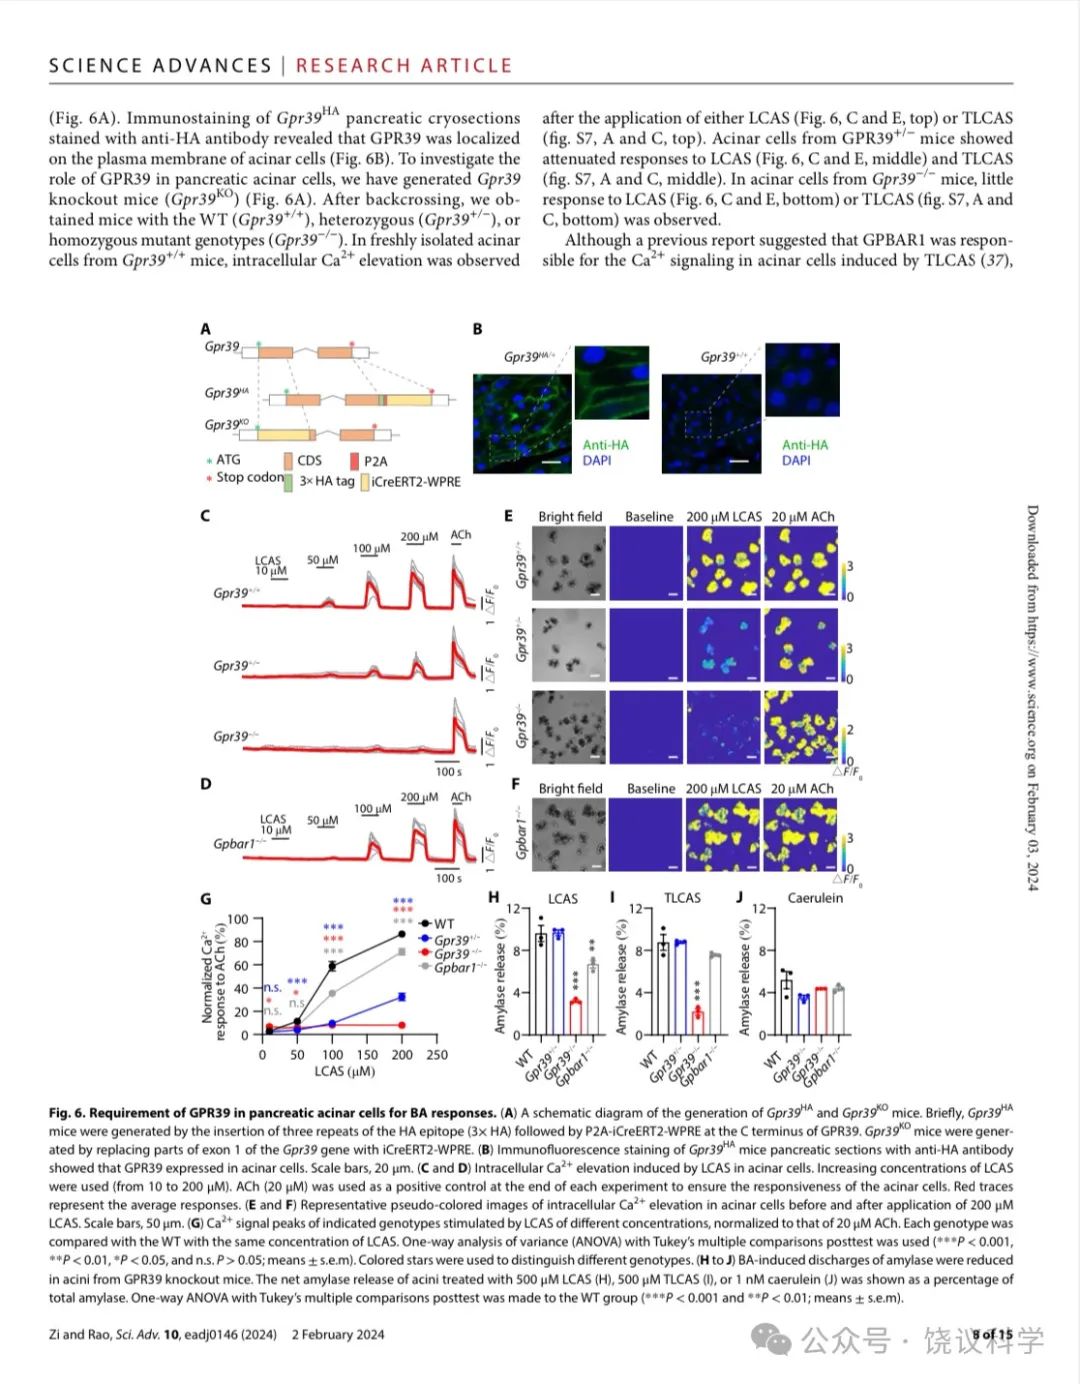
GPR39已经被发现表达在胰腺 (Egerod et al., 2007; Holst et al., 2009; Moechars et al., 2006)。我们制造了HA-标记的GPR39小鼠(Gpr39HA) (图6A)。用抗-HA抗体染色Gpr39HA胰腺冷冻切片揭示GPR39表达在腺泡细胞的细胞膜上(图6B)。为了研究GPR39在胰腺腺泡细胞的功能,我们制造了GPR39基因敲除小鼠(Gpr39HA) (图6A)。在回交后,我们获得了野生型 (GPR39+/+)、杂合体(GPR39+/-)、和纯合体基因型(GPR39-/-)的小鼠。在从GPR39+/+小鼠新鲜取得的腺泡细胞,LCAS(图6C与6E最上排小图)或TLCAS(附图S7A与S7C最上排小图)可以提高细胞内Ca2+。GPR39+/- 小鼠的腺泡细胞对LCAS (图6C与6E中排小图) 和TLCAS (附图S7A与S7C中排小图)呈的反应较野生型的减小。GPR39-/- 小鼠的腺泡细胞对LCAS (图6C与6E底排小图) 和TLCAS (附图S7A与S7C底排小图)呈的反应较野生型的很小。
虽然以前报道提示GPBAR1负责介导TLCAS引起腺泡细胞的Ca2+ 信号 (Perides et al., 2010a),我们观察到GPBAR1 基因剔除小鼠(GPBAR1-/-) 来源的腺泡细胞对200 μM LCAS (图6D和6F) 或TLCAS (附图S7B和S7D) 引起的Ca2+ 升高很稳定,无异于野生型小鼠来源的。为了进一步比较,我们标准化了乙酰胆碱(ACh)引起的Ca2+峰值 。结果显示,在所有检测的浓度(50, 100, 150 and 200 mM) ,LCAS (图6G) or TLCAS (附图S7E)引起的Ca2+ 升高在GPR39基因剔除后都缺乏。而 Ca2+ 信号只在GPBAR1-/- 小鼠对100 mM的LCAS或TLCAS的反应稍有减小(图6G 与附图S7E) 。即使在此浓度,GPBAR1-/- 小鼠的Ca2+ 信号仍然大于GPR39+/- 小鼠 (图6G 与附图S7E)。另外,具有通过GPBAR1受体引起cAMP增加的胆酸、或者GPBAR1的激动剂INT-777都不能导致腺泡细胞的Ca2+ 升高。这些结果支持GPR39在介导胆酸引起腺泡细胞Ca2+ 升高的作用,而GPBAR1在这方面的作用较低重要性。
腺泡细胞的分泌依赖于细胞内Ca2+ (Sung and Williams, 1988), TLCAS刺激的淀粉酶分泌被报道为依赖于Ca2+但不依赖于GPBAR1 (Perides et al., 2010a)。我们检测了LCAS、TLCAS已经另外一个刺激分泌的雨蛙肽刺激腺泡细胞分泌淀粉酶。剔除GPR39显著减少LCAS (图6H) 或TLCAS (图6I) 引起的腺泡细胞分泌淀粉酶,但不影响雨蛙肽的作用(图6J) 。剔除GPBAR1不影响TLCAS或雨蛙肽引起的淀粉酶释放 (图6I与6J)。LCAS引起的淀粉酶释放在GPBAR1-/- 小鼠来源的胰腺腺泡细胞减少,但仍然高于GPR39-/- 小鼠来源的胰腺腺泡细胞(图6H)。GPR39的作用重要性再次高于GPBAR1。这些结果显示GPR39对于胆酸刺激胰腺腺泡细胞内Ca2+ 升高、及其释放淀粉酶都是必需的。
GPR39在胆酸诱导急性胰腺炎(AP)过程中的作用
细胞内Ca2+过多和腺泡细胞死亡被认为发生于AP的早期(Lee and Papachristou, 2019; Pallagi et al., 2020; Petersen and Sutton, 2006; Saluja et al., 2019; Voronina et al., 2005)。 我们用GPR39基因剔除小鼠来检验GPR39是否参与胆酸诱导AP。
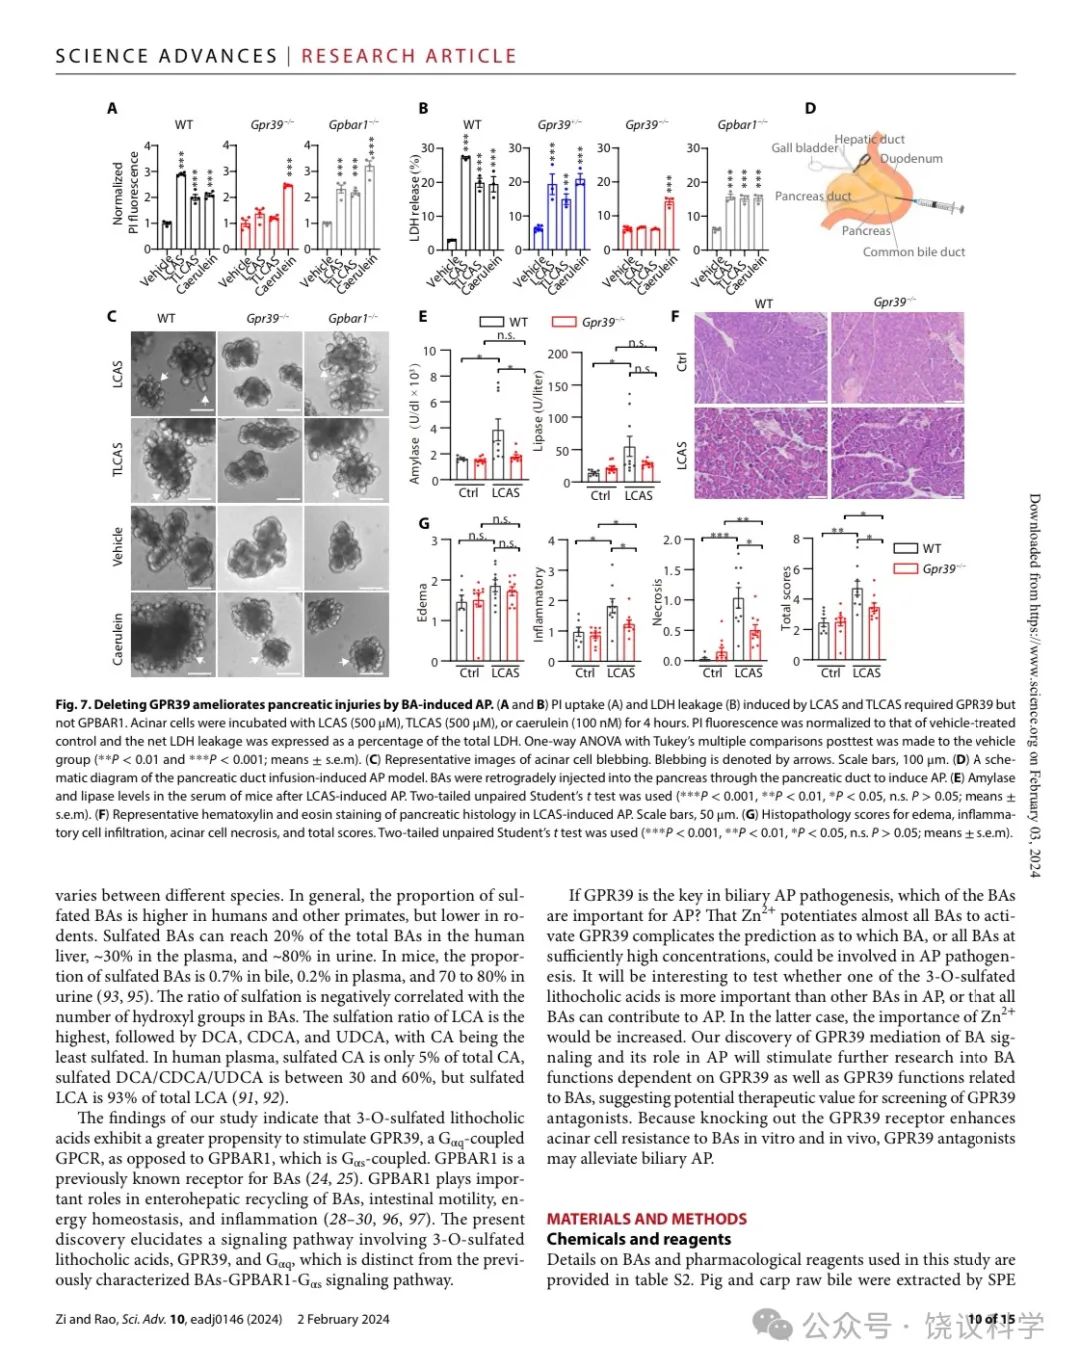
首先, 我们从小鼠分离腺泡细胞。细胞损伤由碘化丙啶(PI)摄取和乳酸脱氢酶(LDH)释放来监测。LCAS、TLCAS或雨蛙肽都诱导从野生型小鼠分离的腺泡细胞摄取PI(图7A) 。 LCAS、TLCAS或雨蛙肽也都增加从野生型小鼠分离的腺泡细胞释放LDH(图7B) 。GPR39基因剔除可以, GPBAR1基因敲除不可以让腺泡细胞抵抗LCAS或TLCAS诱导的细胞坏死, 但不影响雨蛙肽引起的细胞坏死(图7A与7B)。高浓度TLCAS和雨蛙肽诱导的细胞损伤伴随细胞起泡(Singh and McNiven,2008;Husain et al., 2012)。LCAS、TLCAS和雨蛙肽刺激野生型和GPBAR1-/-小鼠来源的胰腺腺泡细胞可以观察到这些形态变化,而同样条件下,GPR39-/-小鼠来源的胰腺腺泡细胞没有这些形态变化(图7C) 。
我们下一步通过把胆酸注射到胰管制造体内AP模型(Laukkarinen et al., 2007; Perides et al., 2010b) (图7D)。LCAS在Serum levels of amylase and lipase were significantly increased by LCAS in GPR39+/+ 野生型小鼠可以显著增加血清中淀粉酶和脂酶浓度, 但在 GPR39-/- 小鼠不能(图7E)。组织学检测显示LCAS在野生型小鼠诱导水肿、炎症和坏死 (图7F与7G)。LCAS诱导的炎症和坏死都在 GPR39-/- 小鼠显著减轻 (图7G)。虽然TLCAS诱导胰腺炎弱于LCAS, GPR39-/- 小鼠仍然显示在TLCAS诱导的医学院显示更低的组织病理学打分(附图S7J和S7K)。这些结果显示GPR39参与体内胆汁性急性胰腺炎的病理发生过程。
讨论
1997年,编码GPR39受体的cDNA被克隆(McKee et al., 1997)。2004年发现Zn2+可以激活GPR39(Holst et al., 2004)。曾报道obestatin是GPR39内源配体但不能被重复(Zhang et al., 2005; Lauwers et al., 2006; Yasuda et al., 2007; Holst et al., 2007)。所以长期以来Zn2+是GPR39唯一已知的内源配体(Yasuda et al., 2007; Holst et al., 2007;Chartrel et al., 2007)。在此,我们显示GPR39为胆酸的新的细胞膜受体。已证明可以别构调节多种GPCR (van der Westhuizen et al., 2015)。对于GPR39来说,Zn2+结合位点在N-末端(H17与H19),不同于通常在跨膜区和细胞外区2的结合口袋(Storjohann et al., 2008;Hauser et al., 2021)。发现但是激活GPR39不依赖Zn2+结合位点提示Zn2+只是GPR39的别构调节配体,而胆酸才是其内源正构配体。
胆酸激活GPR39还可能有其他生理病理功能。例如,GPR39高度表达在肝脏和小肠(Moechars et al., 2006;Egerod et al., 2007)。但是在肝胆管和小肠肠道存在,浓度从 1 mM到200 mM (Ahmad and Haeusler, 2019)。稀释的胆酸提取物可以激活GPR39 (图4L至4N)。GPR39表达型式与但是分布的重叠支持GPR39在小肠感受胆酸的可能性。GPR39在消化道上皮细胞表达丰富,它们是肠道对抗微生物的关键天然免疫屏障(Moechars et al., 2006;Egerod et al., 2007)。GPR39激活调节肠细胞的pH自稳态,增加上皮紧密连接,对小肠粘膜屏障的完整性很重要(Azriel-Tair et al., 2004;Cohen et al., 2014)。
胆酸和Zn2+增强作用的功能重要性可能是未来研究的有趣路径。在小肠上皮,病原体诱导Paneth细胞通过囊泡释放抗微生物组分和Zn2+(Podany et al., 2016)。在这里,Paneth细胞释放的Zn2+是否与胆酸信号相互作用,调节上皮细胞的完整性? 本文分析高浓度胆酸激活GPR39在胆汁性AP过程的病理作用。胆酸,在生理条件性,胰腺暴露的胆酸浓度低很多(系统血浆浓度0.2-22 mM) (Ahmad and Haeusler, 2019)。值得注意Zn2+也与胰岛素一道从胰岛b-细胞所共同释放,GPR39也表达在胰岛中(Moechars et al., 2006;Li et al., 2014)。好奇GPR39是否胰腺的Zn2+感受器,血中的胆酸(特别是3-O-硫酸化石胆酸)是否胰岛素分泌时在调节胰岛和外分泌腺泡细胞功能中有作用。更广泛地,胆酸和Zn2+在其他背景的功能有待研究。
硫酸化被认为是胆酸解毒的途径(Alnouti et al., 2009),3-O-硫酸化是人的主要型式(Bathena et al., 2013;Thakare et al., 2018a, 2018b)。硫酸化胆酸被认为是胆酸代谢的最终产物(Alnouti et al., 2009),因为它们很容易被从体内排出。硫酸化可以改善胆酸的电负性,增加其水溶性。硫酸化胆酸的去垢剂特点弱于非硫酸化的导师,而硫酸化胆酸的临界微粒年代提高(Yousef et al., 1987)。不同种属间硫酸化胆酸的比例不同。通常,硫酸化胆酸在人与灵长类较高,在啮齿类较低。硫酸化胆酸在人肝中占胆酸的20%、血浆的约30%、尿的约80%。小鼠中,硫酸化胆酸在胆汁中占胆酸的0.7%、血浆的0.2%、尿的70-80%(Huang et al., 2011;Thakare et al., 2018)。硫酸化比例与当时中羟基数量成反比,CA的硫酸化最低。人血浆中,硫酸化CA只占总CA的5%,硫酸化DCA/CDCA/UDCA占30-60%,而硫酸化LCA站总LCA的93%(Bathena et al., 2013;Thakare et al., 2018a)。
我们研究的发现显示3-O-硫酸化石胆酸有较大的努力刺激Gαq-偶联的GPR39,而不是Gαs-偶联的GPBAR1。此前已知GPBAR1是胆酸的受体(Maruyama et al., 2002;Kawamata et al., 2003)。GPBAR1在胆酸的肝肠循环、小肠运动、能量自稳态和炎症中起重要作用(Thomas et al., 2009;de Aguiar Valim et al., 2013;Li and Chiang, 2014;Reich et al., 2017;Molinaro and Wahlstrom,2018)。
现在的发现阐明了一个新的信号通路,涉及3-O-硫酸化石胆酸-GPR39-Gαq-Ca2+,不同于此前研究的胆酸-GPBAR1-Gαs-cAMP信号通路。
如果GPR39是胆汁性AP疾病发生的关键,哪一个胆酸对AP重要? Zn2+增强所有胆酸对GPR39的刺激让预计哪个胆酸复杂化了,或所有胆酸在足够高浓度都可以参与AP。有趣检测哪个3-O-硫酸化石胆酸比其他胆酸在AP中更重要,或所有胆酸参与AP。后者的情况下,Zn2+的重要性增加。我们发现GPR39介导胆酸信号并参与AP,将刺激研究胆酸依赖GPR39的功能、也刺激研究GPR39与胆酸相关的功能,提示筛选GPR39抑制剂的可能治疗价值。因为敲除GPR39受体在体外和体内实验都增加腺泡细胞对胆酸的抵抗性,GPR39拮抗剂可能减轻胆汁性AP。
材料与方法
化合物与试剂
本研究所用的胆酸和药理试剂细节见附表S2。猪和鲤鱼胆酸粗提用固态提取法(SPE) (Hahn et al., 2018, 2019)。简而言之, 0.5 ml 新鲜胆酸加入到10 ml 热的 95:5 (v/v) 乙醇和甲醇混合物。混匀和冷却后,样本在4oC ,以13,000 g 离心5 分钟。上清用纯水稀释,达到酒精浓度的10%,溶液过C-18 固相柱(Supelclean LC-18 SPE Tube, 床重 2克, Merck)。柱的激活用10 ml 100%甲醇接10 ml of 10% 甲醇。加工后的胆汁样本(相应于 0.5 ml 胆汁)过已条件化的注,然后用10 ml 10% 甲醇洗。最后用20 ml 甲醇洗脱柱。洗脱物用离心干燥机在30oC浓缩,化于0.5 ml 水。这一提取物作为粗提胆汁。
胰腺腺泡细胞表达的孤儿 GPCRs分析
胰腺单细胞RNA测序资料来自ArrayExpress (E-MTAB-5061) (Segerstolpe et al., 2016)。 它含3514个单细胞转录组,我们从人的胰腺腺泡细胞中提取了112 个。在腺泡细胞中每一种GPCR的平均表达水平都计算了。GPCR孤儿的单子见IUPHAR 资料库 (Alexander et al., 2017)。
分子生物学
所有20种GPCRs已经6种 GPR39相关受体都来自人,其cDNA购自GenScript (中国, 南京). 小鼠GPR39 (NP_081953.2) cDNA 自小鼠胰腺克隆。人类GPR39 (NP_001499.1) cDNA购自 Vigenebio (中国, 山东)。Gallus Gallus (NP_001073574.1), Gekko japonicus (XP_015264640.1), Xenopus laevis (XP_041434441.1)和斑马鱼的(NP_956711.1) GPR39 cDNA由南京的 GenScript 合成。所有cDNAs 被克隆到pCMV6-Entry 载体(Origene), GPCR在同框接P2A连接子后融合于mCherry。
Site-directed mutagenesis to generate GPR39 mutants was carried out with the PCR overlap extension method, and all constructs were verified by sequencing.
稳定细胞系
Stable HEK293 cell lines expressing the mouse GPR39 gene weregenerated by the lentivirus system. In brief, mouse GPR39 fused with mCherry by a P2A linker was cloned into the pLVX vector (Clontech). pLVX-mGPR39-P2A-mCherry plasmid was co-transfected with packaging plasmids pMD2.G (Addgene, 12259) and psPAX2 (Addgene, 12260) into HEK293T cells using Lipofectamine3000 (Invitrogen). After 24 h of transfection, the cells were treated with 2 μg/ml puromycin for 2 days, before selection of GPR39-expressing single clones by mCherry fluorescence protein using flow sorting. Stable human GPR39-expressing cell lines were obtained similarly.
动物
GPR39-HA knock-in mice (Gpr39HA) and GPR39 knock out mice (Gpr39KOor Gpr39-/-) were created with CRISPR/EGETM platform in C57BL/6 strain by Beijing Biocytogen. For GPR39 knock out mice, the first 750 bps in exon 1 of the Gpr39 gene was replaced by iCreERT2-WPRE-PA element. All strains were verified by PCR sequencing of the targeting region, and southern blots were performed to rule out random insertions. Gpbar1 knock out mice (Gpbar1-/-) in C57BL/6 background were kindly donated by Dr. Changtao Jiang (101). All animal procedures performed in this paper were approved by Institutional Animal Care and Use Committee (IACUC) of Peking University.
Ca2+成像
HEK293T cells was cultured in Dulbeco’s minimal essential media (DMEM) supplemented with 10% fetal bovine serum (FBS) and 1% Penicillin/Streptomycin at 37oC and 5% CO2. For preliminary screening of the twenty candidate GPCRs, HEK293T cells stably expressingGα15 and GCaMP6s were used. HEK293T-Gα15-GCaMP6s cells were seeded in poly-D-lysine (PDL)-coated clear bottom 96-well plates. The next day, GPCR expressing constructs were transfected, before replacement of the culture medium by 50 μl recording buffer (150 mM NaCl, 4 mM KCl, 10 mM HEPES, 11 mM glucose, 2 mM MgCl2, 2 mM CaCl2, pH at 7.4) in each well 16 hours after transfection. A Leica TCS SP5 microscopewas used to monitor intracellular Ca2+ changes induced by 50 μl BA, which was added into the well by a pipette. If Fluo-8 AM (AAT Bioquest) was used, culture media were first replaced by 50μl dye loading buffer (2 μg/ml Fluo-8 AM in recording buffer) before incubation for 25 min at room temperature (RT). The dye loading buffer was replaced by an equal volume of recording buffer for 5 min before recording.
检测GPBAR1激活
Activation of GPBAR1 by BAs was detected by the cAMP response element (CRE) and luciferase reporter system(64). The GPBAR1-expressing reporter cell line was a gift from Dr. Yulong Li. Briefly, when cells reached nearly 100% density in 96-well plates, the culture medium was replaced by FBS-free DMEM supplemented with indicated BAs. Cells were cultured at 37oC in 5% CO2 for 10 hours. After which, 10 ml medium in each well was transferred into a 96-well plate, and 100 mL coelenterazine-h solution (2.5 mg/ml in PBS) was added. After 2 min incubation, luminescence was detected by an EnVision plate reader. 100 ml TLCA was used as the positive control and luminescence of TLCA treated wells was set as 100% and the others were normalized.
计算受体激活相对内在活性 (RAi)
The RAi values(65) were used to quantify the potency and the efficacy of BAs. For each receptor, the efficacy value (Emax) of each BA was divided by the EC50, and the Emax/EC50 value was normalized to the maximum value among 30 BAs. We took the logarithm (Log10) of the normalized Emax/EC50 to give a LogRAi value. To quantify BAs which have an ambiguous EC50 (EC50>100μM or EC50>200 μM), we set these EC50 values as 200 μM. In order to obtain a converged LogRAi value, normalized RAi value smaller than 0.001 was set as 0.001. For the GPR39 receptor, we calculated the RAi values in the presence or absence of 4 μM Zn2+ separately.
小鼠胰腺免疫染色
Freshly isolated pancreases were fixed in 4% paraformaldehyde (PFA) and dehydrated by 30% sucrose. Then cryosections (40 μm) were cut using a freezing microtome (Leica CM 3050). For detecting the expression of HA-tagged GPR39 in pancreas slides, rabbit anti-HA antibody (CST, cat.3724S, 1:500 dilution) was used, and the secondary antibody was Alexa Fluor 488 anti-rabbit IgG (Life Technology, 1:2000 dilution). Slides were mounted with DAPI Fluoromount-G (SouthernBiotech, cat.0100-20) and imaged by a confocal microscope (Zesis LSM880).
腺泡细胞分离和Ca2+成像
Acinar cells were prepared according to previous reports(102, 103). Briefly, HEPES-buffered DMEM (Macklin, D6512) with 0.1mg/ml SBTI (Sigma, T9128) bubbled with O2 was used as the dissection buffer. Freshly dissected pancreas were digested with 2 mg/ml collagenase IV (Sigma, V900893) dissolved in the dissection buffer containing 2.5 mg/ml BSA. 5ml collagenase solution was repeatedly injected into the pancreas, before the pancreas was cut into small pieces and transferred into a flask. After gassing with O2, the flask was incubated at 37oC with shacking at 120 rpm for 10 min, then collagenase was replaced with 5ml fresh solution and the pancreas was digested for another 30 min. The pieces were dissociated into acini by gently pipetting and the suspension was then filtered through 50 mm nylon cloth into a 50 ml centrifuge tube. Acini were further separated and collected from the suspension by centrifugation as described (103) and maintained in the dissection buffer containing 1mg/ml BSA before imaging. Cells were imaged in the acinus recording buffer (95 mM NaCl, 4.7 mM KCl, 20 mM HEPES, 10 mM glucose, 2 mM glutamine, 0.6 mM MgCl2, 1.3 mM CaCl2, 1×NEAA, pH at 7.4). Freshly isolated acinar cells were loaded with 4μg/ml of Fluo-8 AM for 30 min at RT in the acinus recording buffer. Cells settled on a Cell-Tak (Corning) treated φ12 mm slide before the slide was placed in a perfusion chamber. Intracellular Ca2+ changes were monitored by a Zeiss LSM 710 microscope.
监测细胞死亡
Acini used in cell injury/death assay were isolated in a protocol slightly modified from what was described above. The concentration of collagenase IV solution was 1 mg/ml and 150 μm nylon cloth was used to collect larger acini. Isolated acini were resuspended in HEPES-buffered DMEM/F12 (with 1 mg/ml BSA)(104) and distributed into a 48-well plate. Acini were incubated with test compounds at 37 oC for 4 hours and LDH activities in the supernatant were quantified using a LDH-cytotoxicity assay kit (Roche, 4744934001). Total LDH activities were measured after cells lysed by 0.5% Triton X-100, and the LDH release was expressed as a percentage of the total LDH activity.
For PI uptake assay, acini were incubated with BAs for 4h at 37oC in a 48-well plate. After removing the supernatant gently, acini were resuspended in medium containing 2 μg/ml PI. Then 100 μl of the cell suspension was applied to a 384-well plate, and PI fluorescence was measured by a BioTek Cytation5 microplate reader ( bottom reading mode; excitation 536 nm; emission 617 nm). PI fluorescence in the acini was normalized to that of vehicle control.
检测淀粉酶释放
Acini used in amylase release detection were isolated and maintained in a protocol similar to that described for LDH leakage detection. Acini were incubated with BAs at 37oC for 30 min and the amylase activity in the supernatant was measured with an amylase activity assay kit (SIGMA, MAK009). Amylase release of acini treated with the vehicle was measured as basal leakage and total amylase activity was measured after acini were lysed by 0.5 % Triton X-100. The net amylase release was calculated by subtracting basal leakage in each group and expressed as a percentage of the total amylase activity.
逆向注入胆酸诱导急性胰腺炎模型
10-12 weeks old male mice (of 25 to 28 grams in weight) were anesthetized with isoflurane. BAs solution (or saline) containing methyl blue (1mg/ml) was retrogradely infused into the pancreatic duct via a microsyringe pump at a flow rate of 5 ml/min for 10 min as described(79). 5 mM TLCAS was used and dissolved in 0.9% NaCl solution. For LCAS, due to its poor solubility in 0.9% NaCl solution, 3 mM LCAS was used and dissolved in PBS (pH=7.4). All BAs solution should be freshly prepared to avoid precipitation. The severity of pancreatitis was monitored 24 h after the induction. Serum was collected to determine the amylase and lipase levels using commercially supplied kits (Nanjing Jiancheng, C016 for amylase, A054 for lipase). For histopathology, fresh pancreas colored with methyl blue was dissected and trimmed to a size of 5mm * 5mm. After sample fixation, paraffin sections were prepared and stained with hematoxylin-eosin (H&E), and scored blindly (edema graded as 0 = absent, 1 = focally increased between lobules, 2 = diffusely increased between lobules, 3 = acini disrupted, 4 = acini separated; inflammatory cell infiltration grade as 0 = absent, 1 = around ductal margins in ducts, 2 = in < 20% of the lobules of the parenchyma, 3 = in 20%-50% of the lobules of the parenchyma, 4 = in > 50% of the lobules of the parenchyma, and acinar necrosis grade as 0 = absent, 1 = < 5% periductal necrosis, 2 = 5%-20% focal parenchymal necrosis, 3 = 20%-50% diffuse parenchymal necrosis, 4 = > 50% diffuse parenchymal necrosis) according to previous reports with slight modifications (105, 106).
统计
All statistical analyses were carried out with Prism 8 (GraphPad Software). Students’ t test was used to compare two columns of data. One-way ANOVA followed by Tukey's multiple comparison posttest was used to compare multiple columns of data. Statistical significance is denoted by asterisks: n.s.=p>0.05, *=p<0.05, **=p<0.01, ***=p<0.001.
参考文献
1. M. S. Petrov, D. Yadav, Global epidemiology and holistic prevention of pancreatitis. Nat Rev Gastroenterol Hepatol 16, 175-184 (2019).
2. C. E. Forsmark, S. S. Vege, C. M. Wilcox, Acute pancreatitis. N Engl J Med 375, 1972-1981 (2016).
3. C. Bernard, Leçons de physiologie expérimentale appliquée à la médecine: Cours du semestre d'été. 2. (Baillière, 1856).
4. E. L. Opie, The etiology of acute hemorrhagic pancreatitis. Bull Johns Hopkins Hosp 12, 182-185 (1901).
5. W. Halsted, I. Retrojection of bile into the pancreas: a cause of acute hemorrhagic pancreatitis. (Bull Johns Hopkins Hosp, 1901), vol. 12, pp. 179-182.
6. E. L. Opie, The relation of cholelithiasis to disease of the pancreas. Am J Med Sci 43, 1102-1105 (1904).
7. E. L. Opie, The relation of cholelithiasis to disease of the pancreas and to fat necrosis. Am J Med Sci 121, 27-42 (1901).
8. E. L. Opie, The relation op cholelithiasis to disease of the pancreas and to fat necrosis. Am J Med Sci 121, 27-42 (1901).
9. J. M. Acosta, C. L. Ledesma, Gallstone migration as a cause of acute pancreatitis. N Engl J Med 290, 484-487 (1974).
10. A. Peracchia, M. Gafa, L. Sarli, M. Lupi, E. Longinotti, Biliary microlithiasis and acute pancreatitis. Int Surg 70, 315-318 (1985).
11. E. Ros, S. Navarro, C. Bru, A. Garcia-Puges, R. Valderrama, Occult microlithiasis in 'idiopathic' acute pancreatitis: prevention of relapses by cholecystectomy or ursodeoxycholic acid therapy. Gastroenterol 101, 1701-1709 (1991).
12. S. P. Lee, J. F. Nicholls, H. Z. Park, Biliary sludge as a cause of acute pancreatitis. N Engl J Med 326, 589-593 (1992).
13. P. Pallagi, T. Madacsy, A. Varga, J. Maleth, Intracellular Ca2+ signalling in the pathogenesis of acute pancreatitis: recent advances and translational perspectives. Int J Mol Sci 21, (2020).
14. Q. T. Tran et al., Role of bile acids and bile salts in acute pancreatitis: from the experimental to clinical studies. Pancreas 50, 3-11 (2021).
15. A. Saluja, V. Dudeja, R. Dawra, R. P. Sah, Early intra-acinar events in pathogenesis of pancreatitis. Gastroenterol 156, 1979-1993 (2019).
16. K. A. Muili et al., Bile acids induce pancreatic acinar cell injury and pancreatitis by activating calcineurin. J Biol Chem 288, 570-580 (2013).
17. K. A. Muili et al., Pancreatic acinar cell nuclear factor kappaB activation because of bile acid exposure is dependent on calcineurin. J Biol Chem 288, 21065-21073 (2013).
18. P. J. Lee, G. I. Papachristou, New insights into acute pancreatitis. Nat Rev Gastroenterol Hepatol 16, 479-496 (2019).
19. A. Wahlstrom, S. I. Sayin, H. U. Marschall, F. Backhed, Intestinal crosstalk between bile acids and microbiota and its impact on host metabolism. Cell Metab 24, 41-50 (2016).
20. B. L. Copple, T. Li, Pharmacology of bile acid receptors: evolution of bile acids from simple detergents to complex signaling molecules. Pharmacol Res 104, 9-21 (2016).
21. A. F. Hofmann, L. R. Hagey, Key discoveries in bile acid chemistry and biology and their clinical applications: history of the last eight decades. J Lipid Res 55, 1553-1595 (2014).
22. M. Makishima et al., Vitamin D receptor as an intestinal bile acid sensor. Science 296, 1313-1316 (2002).
23. M. Makishima et al., Identification of a nuclear receptor for bile acids. Science 284, 1362-1365 (1999).
24. D. J. Parks et al., Bile acids: natural ligands for an orphan nuclear receptor. Science 284, 1365-1368 (1999).
25. T. Maruyama et al., Identification of membrane-type receptor for bile acids (M-BAR). Biochem Biophys Res Commun 298, 714-719 (2002).
26. Y. Kawamata et al., A G protein-coupled receptor responsive to bile acids. J Biol Chem 278, 9435-9440 (2003).
27. H. Wang, J. Chen, K. Hollister, L. C. Sowers, B. M. Forman, Endogenous bile acids are ligands for the nuclear receptor FXR/BAR. Mol Cell 3, 543-553 (1999).
28. C. Thomas, R. Pellicciari, M. Pruzanski, J. Auwerx, K. Schoonjans, Targeting bile-acid signalling for metabolic diseases. Nat Rev Drug Discov 7, 678-693 (2008).
29. A. Molinaro, A. Wahlstrom, H. U. Marschall, Role of bile acids in metabolic control. Trends Endocrinol Metab 29, 31-41 (2018).
30. T. Q. de Aguiar Vallim, E. J. Tarling, P. A. Edwards, Pleiotropic roles of bile acids in metabolism. Cell Metab 17, 657-669 (2013).
31. C. Thomas et al., TGR5-mediated bile acid sensing controls glucose homeostasis. Cell Metab 10, 167-177 (2009).
32. L. Adorini, M. Pruzanski, D. Shapiro, Farnesoid X receptor targeting to treat nonalcoholic steatohepatitis. Drug Discov Today 17, 988-997 (2012).
33. A. I. Orabi et al., Cluster of differentiation 38 (CD38) mediates bile acid-induced acinar cell injury and pancreatitis through cyclic ADP-ribose and intracellular calcium release. J Biol Chem 288, 27128-27137 (2013).
34. R. H. Palmer, The formation of bile acid sulfates: a new pathway of bile acid metabolism in humans. Proc Natl Acad Sci USA 58, 1047-1050 (1967).
35. S. Voronina, R. Longbottom, R. Sutton, O. H. Petersen, A. Tepikin, Bile acids induce calcium signals in mouse pancreatic acinar cells: implications for bile-induced pancreatic pathology. J Physiol 540, 49-55 (2002).
36. J. Y. Kim et al., Transporter-mediated bile acid uptake causes Ca2+-dependent cell death in rat pancreatic acinar cells. Gastroenterol 122, 1941-1953 (2002).
37. J. V. Gerasimenko et al., Bile acids induce Ca2+ release from both the endoplasmic reticulum and acidic intracellular calcium stores through activation of inositol trisphosphate receptors and ryanodine receptors. J Biol Chem 281, 40154-40163 (2006).
38. G. Perides, J. M. Laukkarinen, G. Vassileva, M. L. Steer, Biliary acute pancreatitis in mice is mediated by the G-protein-coupled cell surface bile acid receptor Gpbar1. Gastroenterol 138, 715-725 (2010).
39. S. G. Voronina et al., Bile acids induce a cationic current, depolarizing pancreatic acinar cells and increasing the intracellular Na+concentration. J Biol Chem 280, 1764-1770 (2005).
40. S. G. Voronina, S. L. Barrow, O. V. Gerasimenko, O. H. Petersen, A. V. Tepikin, Effects of secretagogues and bile acids on mitochondrial membrane potential of pancreatic acinar cells: comparison of different modes of evaluating DeltaPsim. J Biol Chem 279, 27327-27338 (2004).
41. J. Louhimo, M. L. Steer, G. Perides, Necroptosis is an important severity determinant and potential therapeutic target in experimental severe pancreatitis. Cell Mol Gastroenterol Hepatol 2, 519-535 (2016).
42. A. S. Hauser, M. M. Attwood, M. Rask-Andersen, H. B. Schioth, D. E. Gloriam, Trends in GPCR drug discovery: new agents, targets and indications. Nat Rev Drug Discov 16, 829-842 (2017).
43. A. P. Davenport et al., International Union of Basic and Clinical Pharmacology. LXXXVIII. G protein-coupled receptor list: recommendations for new pairings with cognate ligands. Pharmacol Rev 65, 967-986 (2013).
44. S. M. Foord et al., International Union of Pharmacology. XLVI. G protein-coupled receptor list. Pharmacol Rev 57, 279-288 (2005).
45. A. T. Ehrlich et al., Expression map of 78 brain-expressed mouse orphan GPCRs provides a translational resource for neuropsychiatric research. Commun Biol 1, 102 (2018).
46. J. B. Regard, I. T. Sato, S. R. Coughlin, Anatomical profiling of G protein-coupled receptor expression. Cell 135, 561-571 (2008).
47. S. P. Alexander et al., The concise guide to pharmacology 2017/18: G protein-coupled receptors. Br J Pharmacol 174 Suppl 1, S17-S129 (2017).
48. A. Wise, S. C. Jupe, S. Rees, The identification of ligands at orphan G-protein coupled receptors. Annu Rev Pharmacol Toxicol 44, 43-66 (2004).
49. M. Rask-Andersen, S. Masuram, H. B. Schioth, The druggable genome: evaluation of drug targets in clinical trials suggests major shifts in molecular class and indication. Annu Rev Pharmacol Toxicol 54, 9-26 (2014).
50. K. Sriram, P. A. Insel, G protein-coupled receptors as targets for approved drugs: how many targets and how many drugs? Mol Pharmacol 93, 251-258 (2018).
51. M. Kojima, K. Kangawa, Ghrelin: structure and function. Physiol Rev 85, 495-522 (2005).
52. K. L. Egerod et al., GPR39 splice variants versus antisense gene LYPD1: expression and regulation in gastrointestinal tract, endocrine pancreas, liver, and white adipose tissue. Mol Endocrinol 21, 1685-1698 (2007).
53. D. Moechars et al., Altered gastrointestinal and metabolic function in the GPR39-obestatin receptor-knockout mouse. Gastroenterology 131, 1131-1141 (2006).
54. L. Cohen, I. Sekler, M. Hershfinkel, The zinc sensing receptor, ZnR/GPR39, controls proliferation and differentiation of colonocytes and thereby tight junction formation in the colon. Cell Death Dis 5, e1307 (2014).
55. S. P. Meda Venkata et al., Inhibition of GPR39 restores defects in endothelial cell-mediated neovascularization under the duress of chronic hyperglycemia: Evidence for regulatory roles of the sonic hedgehog signaling axis. Proc Natl Acad Sci USA 120, e2208541120 (2023).
56. S. Yasuda et al., Isolation of Zn2+ as an endogenous agonist of GPR39 from fetal bovine serum. J Recept Signal Transduct Res 27, 235-246 (2007).
57.B. Holst et al., Common structural basis for constitutive activity of the ghrelin receptor family. J Biol Chem 279, 53806-53817 (2004).
58.B. Holst et al., GPR39 signaling is stimulated by zinc ions but not by obestatin. Endocrinology 148, 13-20 (2007).
59.A. P. Campbell, A. V. Smrcka, Targeting G protein-coupled receptor signalling by blocking G proteins. Nat Rev Drug Discov 17, 789-803 (2018).
60. A. Segerstolpe et al., Single-cell transcriptome profiling of human pancreatic islets in health and type 2 diabetes. Cell Metab 24, 593-607 (2016).
61. T. M. Frimurer et al., Model-based discovery of synthetic agonists for the Zn2+-sensing G-protein-coupled receptor 39 (GPR39) reveals novel biological functions. J Med Chem 60, 886-898 (2017).
62. S. Peukert et al., Discovery of 2-pyridylpyrimidines as the first orally bioavailable GPR39 agonists. ACS Med Chem Lett 5, 1114-1118 (2014).
63. N. J. Alkayed et al., Control of coronary vascular resistance by eicosanoids via a novel GPCR. Am J Physiol Cell Physiol 322, C1011-C1021 (2022).
64. H. Yu et al., MRGPRX4 is a bile acid receptor for human cholestatic itch. Elife 8, (2019).
65. A. Inoue et al., Illuminating G-protein-coupling selectivity of GPCRs. Cell 177, 1933-1947 e1925 (2019).
66. H. Sato et al., Novel potent and selective bile acid derivatives as TGR5 agonists: biological screening, structure-activity relationships, and molecular modeling studies. J Med Chem 51, 1831-1841 (2008).
67.S. N. Chaudhari et al., Bariatric surgery reveals a gut-restricted TGR5 agonist with anti-diabetic effects. Nat Chem Biol 17, 20-29 (2021).
68.W. Alker, T. Schwerdtle, L. Schomburg, H. Haase, A Zinpyr-1-based fluorimetric microassay for free zinc in human serum. Int J Mol Sci 20, (2019).
69.N. Barman et al., Reference value for serum zinc level of adult population in bangladesh. EJIFCC 31, 117-124 (2020).
70. L. Storjohann, B. Holst, T. W. Schwartz, Molecular mechanism of Zn2+ agonism in the extracellular domain of GPR39. FEBS Lett 582, 2583-2588 (2008).
71. A. F. Hofmann, L. R. Hagey, M. D. Krasowski, Bile salts of vertebrates: structural variation and possible evolutionary significance. J Lipid Res 51, 226-246 (2010).
72. M. Kojima et al., Ghrelin is a growth-hormone-releasing acylated peptide from stomach. Nature 402, 656-660 (1999).
73. A. Moulin et al., The 1,2,4-triazole as a scaffold for the design of ghrelin receptor ligands: development of JMV 2959, a potent antagonist. Amino Acids 44, 301-314 (2013).
74. B. Holst et al., G protein-coupled receptor 39 deficiency is associated with pancreatic islet dysfunction. Endocrinology 150, 2577-2585 (2009).
75. C. K. Sung, J. A. Williams, Role of calcium in pancreatic acinar cell secretion. Miner Electrolyte Metab 14, 71-77 (1988).
76. O. H. Petersen, R. Sutton, Ca2+ signalling and pancreatitis: effects of alcohol, bile and coffee. Trends Pharmacol Sci 27, 113-120 (2006).
77. S. Z. Husain et al., Ryanodine receptors contribute to bile acid-induced pathological calcium signaling and pancreatitis in mice. Am J Physiol Gastrointest Liver Physiol 302, G1423-1433 (2012).
78. V. P. Singh, M. A. McNiven, Src-mediated cortactin phosphorylation regulates actin localization and injurious blebbing in acinar cells. Mol Biol Cell 19, 2339-2347 (2008).
79. G. Perides, G. J. van Acker, J. M. Laukkarinen, M. L. Steer, Experimental acute biliary pancreatitis induced by retrograde infusion of bile acids into the mouse pancreatic duct. Nat Protoc 5, 335-341 (2010).
80. J. M. Laukkarinen, G. J. Van Acker, E. R. Weiss, M. L. Steer, G. Perides, A mouse model of acute biliary pancreatitis induced by retrograde pancreatic duct infusion of Na-taurocholate. Gut 56, 1590-1598 (2007).
81. K. K. McKee et al., Cloning and characterization of two human G protein-coupled receptor genes (GPR38 and GPR39) related to the growth hormone secretagogue and neurotensin receptors. Genomics 46, 426-434 (1997).
82. J. V. Zhang et al., Obestatin, a peptide encoded by the ghrelin gene, opposes ghrelin's effects on food intake. Science 310, 996-999 (2005).
83. N. Chartrel et al., Comment on "Obestatin, a peptide encoded by the ghrelin gene, opposes ghrelin's effects on food intake". Science 315, 766; author reply 766 (2007).
84. E. Lauwers, B. Landuyt, L. Arckens, L. Schoofs, W. Luyten, Obestatin does not activate orphan G protein-coupled receptor GPR39. Biochem Biophys Res Commun 351, 21-25 (2006).
85. E. T. van der Westhuizen, C. Valant, P. M. Sexton, A. Christopoulos, Endogenous allosteric modulators of G protein-coupled receptors. J Pharmacol Exp Ther 353, 246-260 (2015).
86. A. S. Hauser, A. J. Kooistra, C. Munk, F.M. Heydenreich, D.B. Veprintsev, M. Bouvier, M.M. Babu, D.E. Gloriam, GPCR activation mechanisms across classes and macro/microscales. Nat Struct Mol Biol 28, 879-888 (2021).
87. T. R. Ahmad, R. A. Haeusler, Bile acids in glucose metabolism and insulin signalling- mechanisms and research needs. Nat Rev Endocrinol15, 701-712 (2019).
88. H. Azriel-Tamir, H. Sharir, B. Schwartz, M. Hershfinkel, Extracellular zinc triggers ERK-dependent activation of Na+/H+ exchange in colonocytes mediated by the zinc-sensing receptor. J Biol Chem 279, 51804-51816 (2004).
89. A. B. Podany, J. Wright, R. Lamendella, D. I. Soybel, S. L. Kelleher, ZnT2-mediated zinc import into Paneth cell granules is necessary for coordinated secretion and Paneth cell function in mice. Cell Mol Gastroenterol Hepatol 2, 369-383 (2016).
90. Y. V. Li, Zinc and insulin in pancreatic beta-cells. Endocrine 45, 178-189 (2014).
91. Y. Alnouti, Bile acid sulfation: a pathway of bile acid elimination and detoxification. Toxicol Sci 108, 225-246 (2009).
92. S. P. Bathena, S. Mukherjee, M. Olivera, Y. Alnouti, The profile of bile acids and their sulfate metabolites in human urine and serum. J Chromatogr B Analyt Technol Biomed Life Sci 942-943, 53-62 (2013).
93. R. Thakare, J. A. Alamoudi, N. Gautam, A. D. Rodrigues, Y. Alnouti, Species differences in bile acids II. bile acid metabolism. J Appl Toxicol38, 1336-1352 (2018).
94. R. Thakare, J. A. Alamoudi, N. Gautam, A. D. Rodrigues, Y. Alnouti, Species differences in bile acids I. plasma and urine bile acid composition. J Appl Toxicol 38, 1323-1335 (2018).
95. I. M. Yousef, S. G. Barnwell, B. Tuchweber, A. Weber, C. C. Roy, Effect of complete sulfation of bile acids on bile formation in rats. Hepatology 7, 535-542 (1987).
96. J. Huang, S. P. Bathena, I. L. Csanaky, Y. Alnouti, Simultaneous characterization of bile acids and their sulfate metabolites in mouse liver, plasma, bile, and urine using LC-MS/MS. J Pharm Biomed Anal 55, 1111-1119 (2011).
97. M. Reich et al., Role of the G protein-coupled bile acid receptor TGR5 in liver damage. Dig Dis 35, 235-240 (2017).
98. T. Li, J. Y. Chiang, Bile acid signaling in metabolic disease and drug therapy. Pharmacol Rev 66, 948-983 (2014).
99. M. A. Hahn, C. Effertz, L. Bigler, E. von Elert, 5alpha-cyprinol sulfate, a bile salt from fish, induces diel vertical migration in Daphnia. Elife8, (2019).
100. M. Hahn, E. von Elert, L. Bigler, M. D. Diaz Hernandez, N. E. Schloerer, 5alpha-Cyprinol sulfate: Complete NMR assignment and revision of earlier published data, including the submission of a computer-readable assignment in NMReDATA format. Magn Reson Chem 56, 1201-1207 (2018).
101. X. Zheng et al., Hyocholic acid species improve glucose homeostasis through a distinct TGR5 and FXR signaling mechanism. Cell Metab 33, 791-803 e797 (2021).
102. A. I. Orabi et al., Preparation of pancreatic acinar cells for the purpose of calcium imaging, cell injury measurements, and adenoviral infection. J Vis Exp, e50391 (2013).
103. J. A. Williams, Isolation of rodent pancreatic acinar cells and acini by collagenase digestion. Pancreapedia: The Exocrine Pancreas Knowledge Base, (2010).
104. A. M. Reed et al., Low extracellular pH induces damage in the pancreatic acinar cell by enhancing calcium signaling. J Biol Chem 286, 1919-1926 (2011).
105. W. Du et al., A microRNA checkpoint for Ca2+ signaling and overload in acute pancreatitis. Mol Ther 30, 1754-1774 (2022).
106.S. Wildi et al., Suppression of transforming growth factor beta signalling aborts caerulein induced pancreatitis and eliminates restricted stimulation at high caerulein concentrations. Gut 56, 685-692 (2007).
致谢
We are grateful to Dr. Yi Xian for the GPCR cDNA library, Dr. Changtao Jiang for sharing the GPBAR1 knock out mice, Dr. Yulong Li for the CRE-Nanoluciferase cell lines, Dr. Shiyu Liu and Dr. Wei Huang for help with mouse AP models, Dr. Yan Zhao for help with Ca2+signaling detection, the National Center for Protein Sciences at Peking University for access to instrumentation, the IMM Experimental Histopathology Platform at Peking University for assistance with paraffin sections and H&E staining, to Changping Laboratory, CIMR and CLS for support.
作者贡献:
Conceptualization: Y.R., Z.Z.
Methodology: Z.Z.
Investigation: Y.R., Z.Z.
Visualization: Z.Z.
Supervision: Y.R.
Writing—original draft: Z.Z.
Writing—review & editing: Y.R.
利益冲突:Z.Z.与Y.R. 为基于本文发现正在申请的国际专利的共同发明人。
Data and materials availability: 所有资料都在正文或附属资料。本研究所产生的材料,如有合理要求,可以从通讯作者 (Y.R.) 处获得。
图与图注
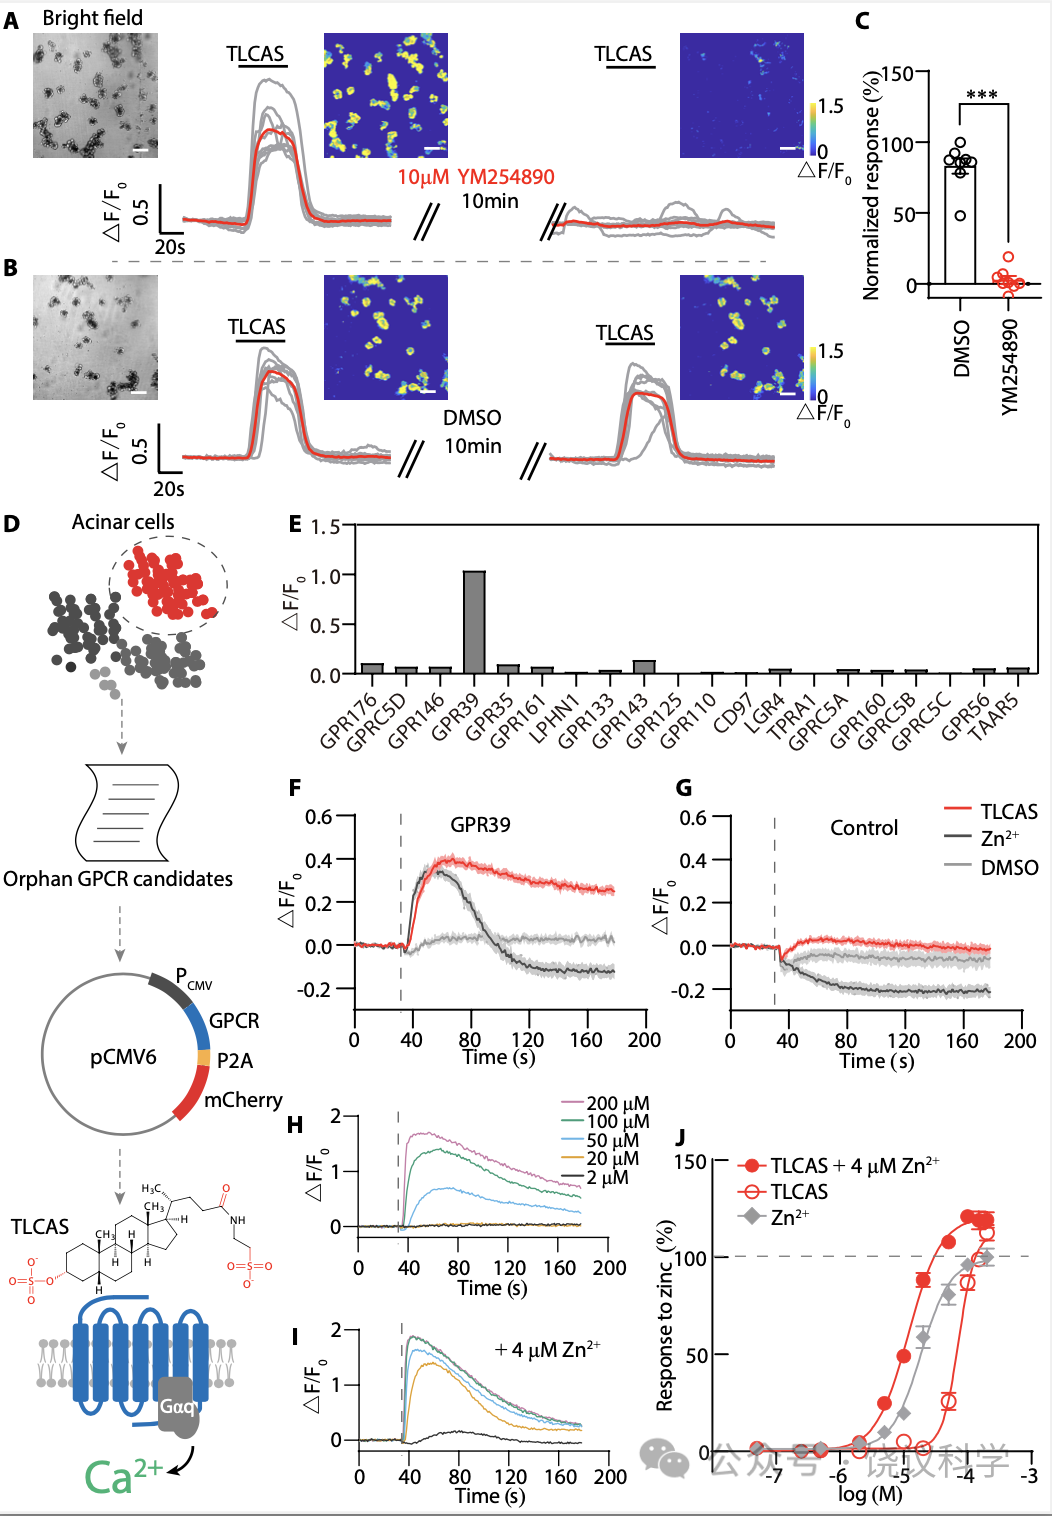
Figure 1. Search for a TLCAS Receptor.(A-B) Ca2+ imaging in isolated pancreatic acinar cells treating with Gαq-inhibitor YM254890 (A) or vehicle DMSO (B). Acinar cells were stimulated with two applications of 500 μM TLCAS. Prior to the second stimulation, the cells were incubated with 10 μM YM254890 (or DMSO) for 10min. Red traces represent the average responses. Scale bar in white is 50 μm. (C) Gαq-inhibitor YM254890 totally diminished the Ca2+elevation induced by TLCAS in acinar cells. The values represent the responses of the second stimulation, which normalized to responses of the first stimulation. Two-tailed unpaired Student’s t-test was used (***p<0.001, n = 8 in each group). (D) A schematic diagram of our GPCR screening strategy. Orphan GPCRs highly expressed in pancreatic acinar cells were cloned and expressed in HEK293T cells expressing Gα15-GCaMP6s, and possible activation of each receptor by TLCAS was measured by intracellular Ca2+ imaging. (E) Results of the intracellular Ca2+ changes mediated by candidate GPCRs in response to 200 μM TLCAS. (F-G) Real-time FLIPR fluorescence curves of intracellular Ca2+changes induced by 200 μM TLCAS or 200 μM Zn2+ in GPR39-expressing cells (F) or the sham transfected cells (G). Dotted line indicates the time points for administration of agents or vehicle. (H) Concentration-dependent activation of GPR39 by TLCAS. Results from a stable HEK293T cell line expressing the GPR39 are shown here. (I) Zn2+enhancement of GPR39 activation by TLCAS. Cells were incubated with 4 μM Zn2+ in the recording buffer for 5 min before the FLIPR assay, and the concentrations of TLCAS were similarly color-indicated as those in (H), except that 4 μM Zn2+ was included for all concentrations of TLCAS. (J) Dose curves of TLCAS and Zn2+ in GPR39 activation. In gray were the doses for Zn2+ alone.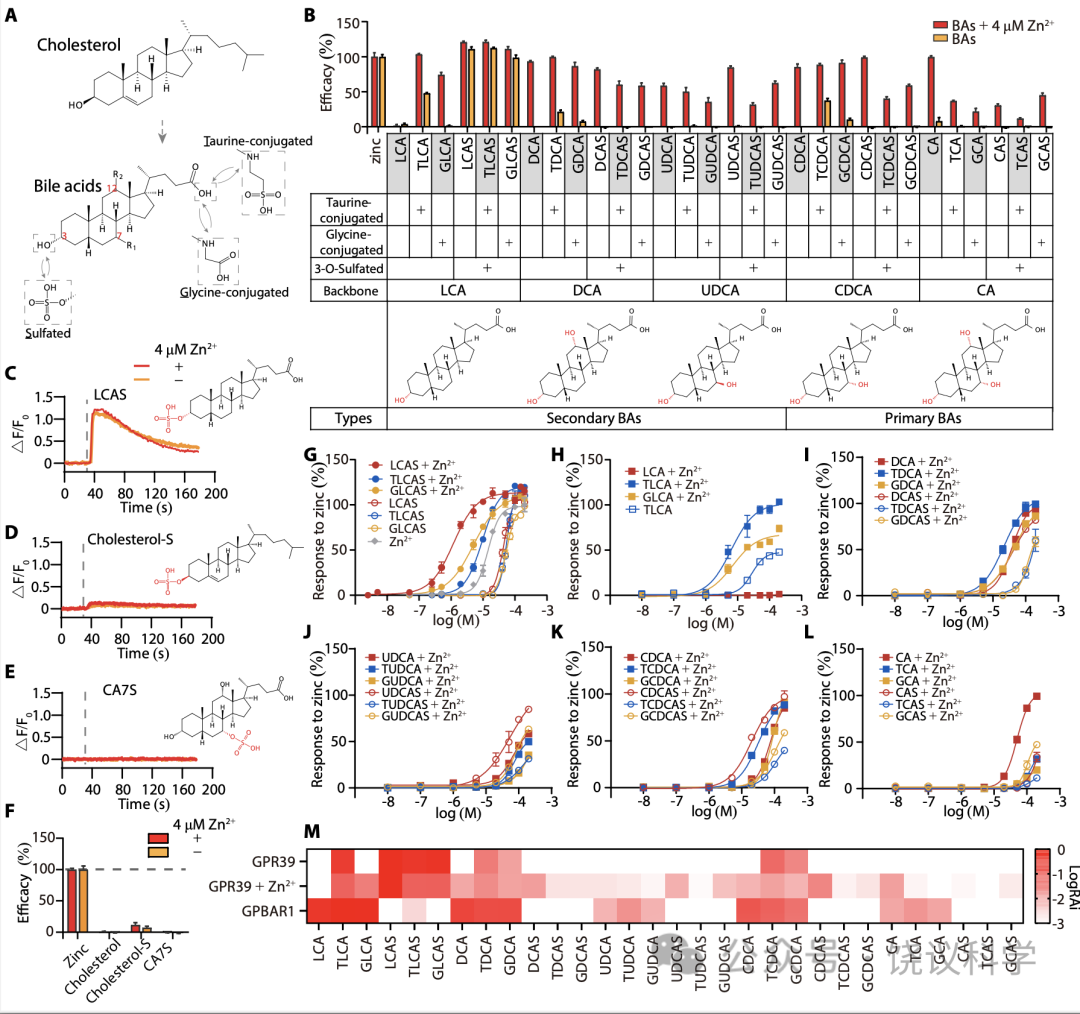
Figure 2. Characterization of GPR39 Mediated Activation by BAs.(A) Structures of cholesterol and BAs. BAs are synthesized from cholesterol and can be modified by sulfate, and amidated by taurine (or glycine). (B) Efficacy of BAs in activating GPR39 in the presence or absence of 4 mM Zn2+ (means + s.e.m; n = 3 or 4 in each group). All values were normalized to that of 200 μM Zn2+. Potency values of 200 μM DCA and CDCA in the absence of Zn2+ were set to zero.Detailed values are shown in fig. S8. (C-E) Real-time FLIPR fluorescence curves of intracellular Ca2+ changes induced by LCAS, cholesterol-S and CA7S in GPR39-expressing cells in the presence or absence of 4 mM Zn2+. All compounds are 200 μM and dotted lines indicate the time points for administration of agents. (F) Efficacy of cholesterol, LCAS, cholesterol-S and CA7S in the presence or absence of 4 mM Zn2+ (means + s.e.m; n = 4 in each group). All values were normalized to that of 200 μM Zn2+. (G-H) Dose response curves of LCA derivatives in the presence or absence of 4 mM Zn2+. Dose response curves of DCA derivatives (I), of UDCA derivatives (J), of CDCA derivatives (K), and CA derivatives (L) in the presence of 4 μM Zn2+. Responses were normalized to 200 μM Zn2+. EC50 values are shown in fig. S8. (M) Heatmap of the LogRAi (logarithm base 10) values for GPR39 and GPBAR1 mediated activation by BAs. Values are shown in fig. S8.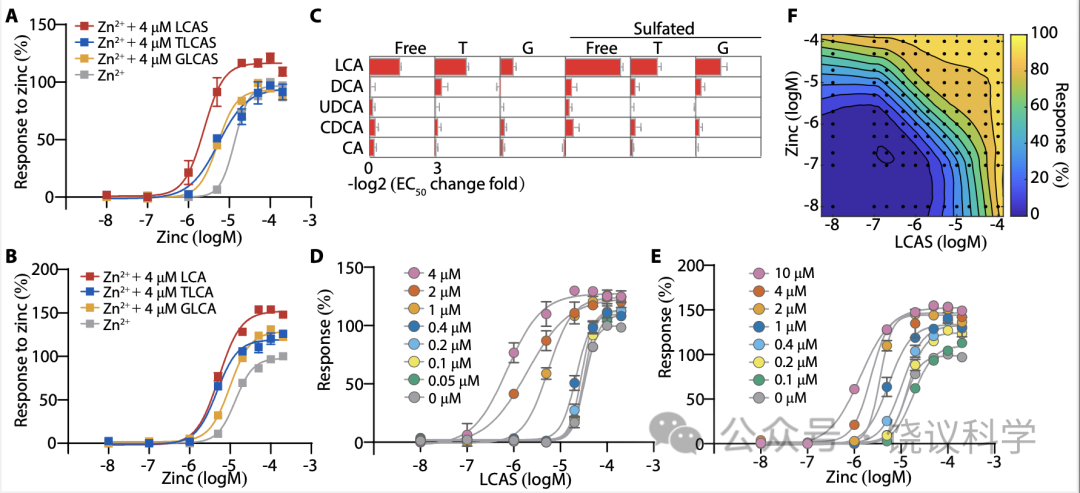
Figure 3. LCA Derivatives Potentiate GPR39 Activation by Zn2+.(A-B) The allosteric effect of LCA derivatives on GPR39 activation by Zn2+. Responses were normalized to 200 μM Zn2+. (C) The potentiation of 30 BAs on GPR39 activation by Zn2+. The ratio of EC50 of Zn2+ in the presence of BAs to EC50 of Zn2+ in the absence of BAs was calculated, and the value was logarithmically (with a base of 2) transformed (means + s.e.m; n = 3 or 4 in each group). Values shown in fig. S8. (D) The dose-curves of GPR39 activated by LCAS in the present of indicated concentrations of Zn2+. Responses were normalized to 200 μM LCAS. (E) The dose-curves of GPR39 activated by Zn2+ in the present of indicated concentrations of LCAS. Responses were normalized to 200 μM Zn2+. (F) The LOWESS-fit response surface of GPR39 co-stimulated with combinations of LCAS and Zn2+. Responses were normalized to the maximum response among all experimentally tested points (black dots).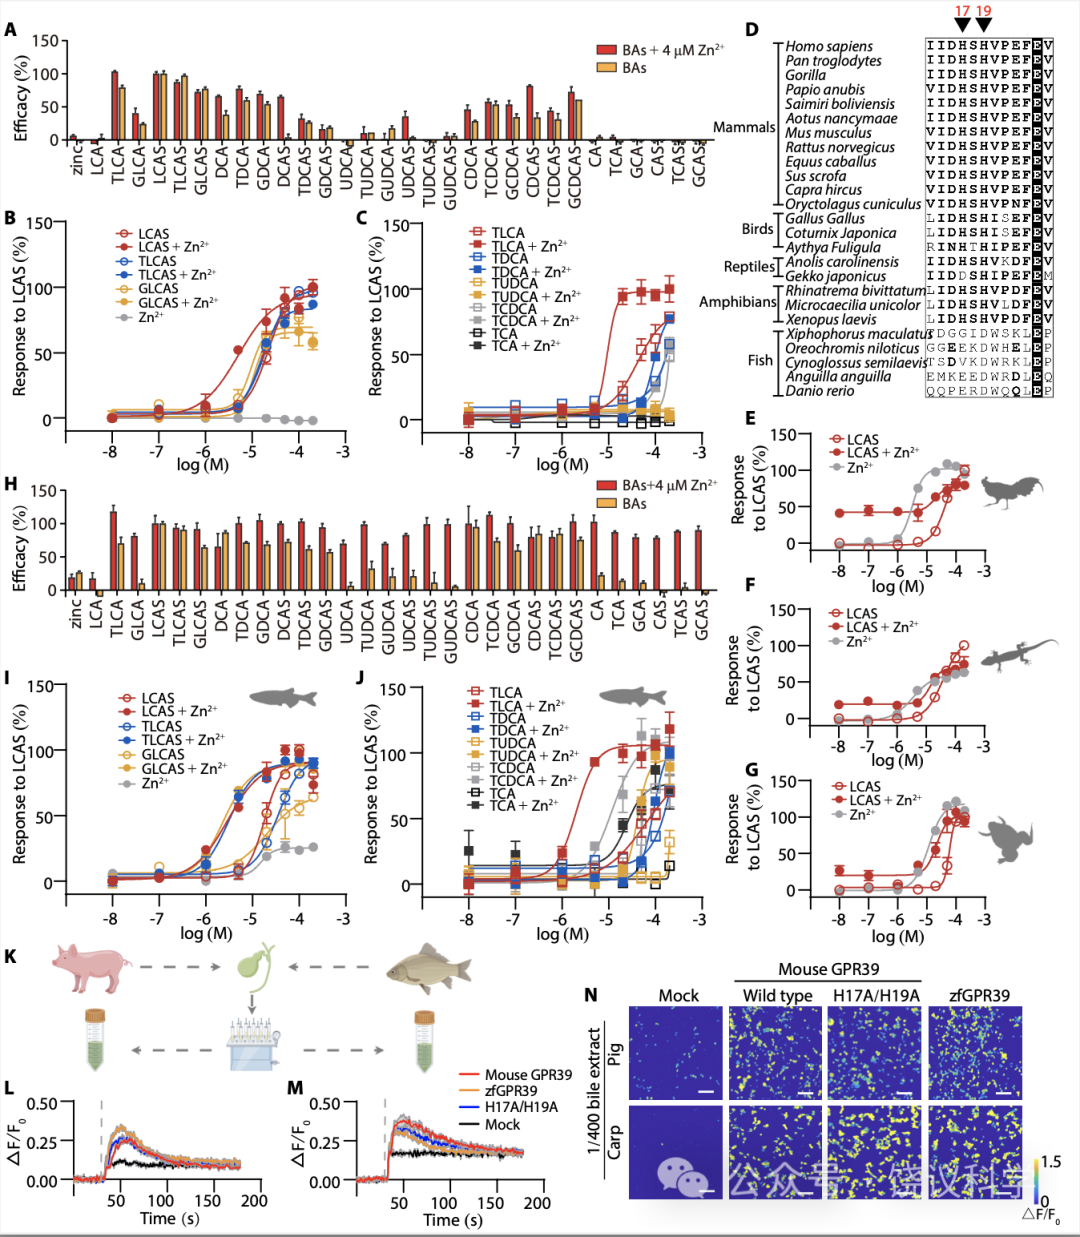
Figure 4. Evolution of Zn2+ Responsiveness After BA Responsiveness in GPR39. (A) Efficacy of BAs in Zn2+insensitive GPR39 mutant H17A/H19A activation in the presence or absence of 4 mM Zn2+ (means + s.e.m; n = 3 or 4 in each group). All values were normalized to the efficacy of 200 μM LCAS. (B-C) Dose response curves of H17A/H19A mutant form of GPR39 by BAs. Responses were normalized to 200 μM LCAS. (D) Multiple sequence alignment of GPR39 receptors from different species. The ClustalW program was used for sequence alignment, and the figure was generated by ESRript3. For each sequence, accession number is shown in table S1. (E-G) Activation of Gallus GallusGPR39 (E), Gekko japonicus GPR39 (F) and Xenopus laevis GPR39 (G) by LCAS and Zn2+. (H) Efficacy of BA activation of the zfGPR39 in the presence or absence of 4 mM Zn2+ (means + s.e.m; n = 3 or 4 in each group). All values were normalized to the efficacy of 200 μM LCAS. (I-J) Dose response curves of the zfGPR39 by BAs. Responses were normalized to 200 μM LCAS. (K) Raw bile samples from pigs and carp were subjected to extraction using a C-18 solid-phase cartridge. The crude extracts were employed to assess the responses of GPR39 to both pig and fish bile. (L-M) FLIPR fluorescence curves of intracellular Ca2+ changes induced by 1/400 diluted pig (L) and carp (M) bile extracts in HEK293T cells expressing mouse GPR39, zfGPR39, H17A/H19A mutant or mock transfected cells. (N) Ca2+ imaging of GPR39-expressing HEK293T cells responding to 1/400 diluted pig and carp bile extracts.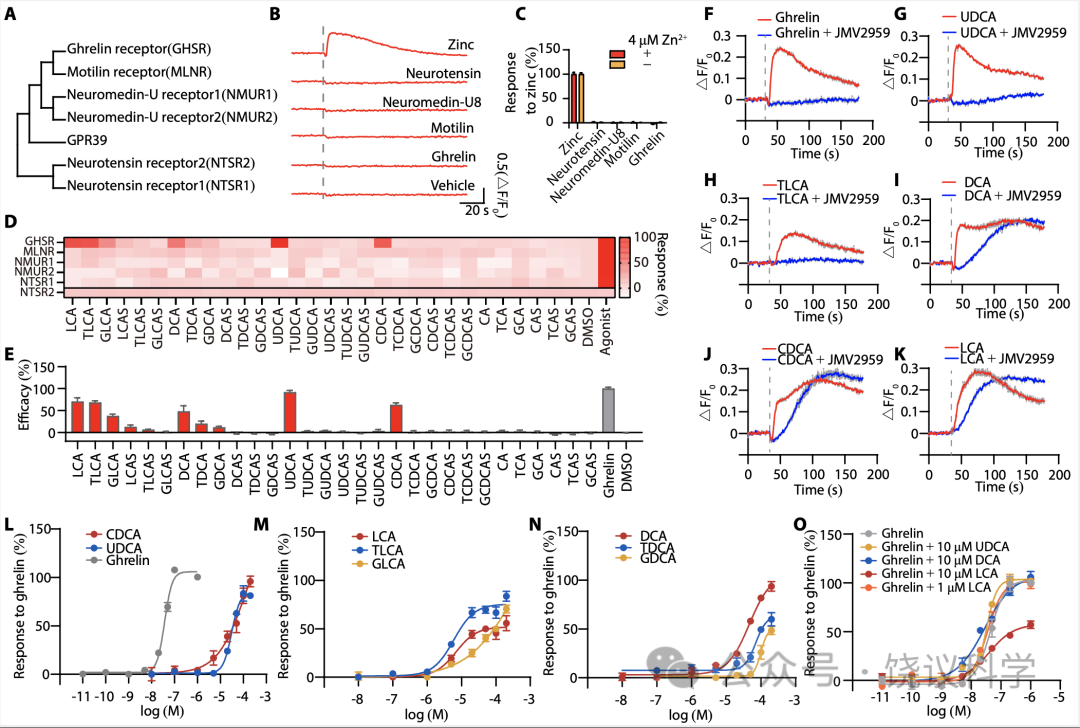
Figure 5. GHSR is activated by BAs. (A) The phylogenetic tree of the ghrelin receptor subfamily. The tree was constructed by MEGA11 and the accession number of each sequence was shown in table S1. (B-C) Testing the activation of GPR39 by different peptides using FLIPR. (B) Typical real-time FLIPR fluorescence curves in the presence of 4μM Zn2+ and (C) efficacy normalized to 200 μM Zn2+ (means + s.e.m; n = 4 in each group). Each used peptide was 1 μM. (D) Activation of GPR39 related receptors by BAs was testing using FLIPR. The concentration of BAs was 200μM. GHSR, MLNR, NMUR1, NMUR2, NTSR1 and NTSR2 were expressed in HEK293T cells expressing Gα15-GCaMP6s, and the activation of each receptor by BAs was measured. 1 μM ghrelin (for GHSR), 200 μM roxithromycin (for MLNR), 1μM neuromedin-U8 (for NMUR1/2) and 1μM neurotensin (for NTSR1/2) were used as positive agonists. All responses were normalized to the corresponding agonists. 1% DMSO was used as a negative control. In our practice, NTSR2 couldn’t be activated by BAs or neurotensin, and the responses of NTSR2 were expressed as △F/F0 values. (E) Efficacy of BAs in activating GHSR (means + s.e.m; n = 6 in each group). All values were normalized to that of 1 μM ghrelin. All BAs were 200 μM and ghrelin was 1 μM. (F-K) Real-time FLIPR fluorescence curves of intracellular Ca2+ changes induced by ghrelin (F), UDCA (G), TLCA (H), DCA (I), CDCA (J) and LCA (K) in GHSR-expressing cells in the presence or absence of GHSR antagonist JMV2959. The concentration of ghrelin (F) was 100 nM and all BAs were 200 μM. Cells were incubated with 10 μM JMV2959 for 10 min before the FLIPR assay and dotted lines indicate the time points for administration of agents. (L-N) The dose-curves of GHSR activated by BAs. All responses were normalized to that of 1 μM ghrelin. (O) The dose-curves of GHSR activated by ghrelin in the presence of indicated BAs. All responses were normalized to that of 1 μM ghrelin.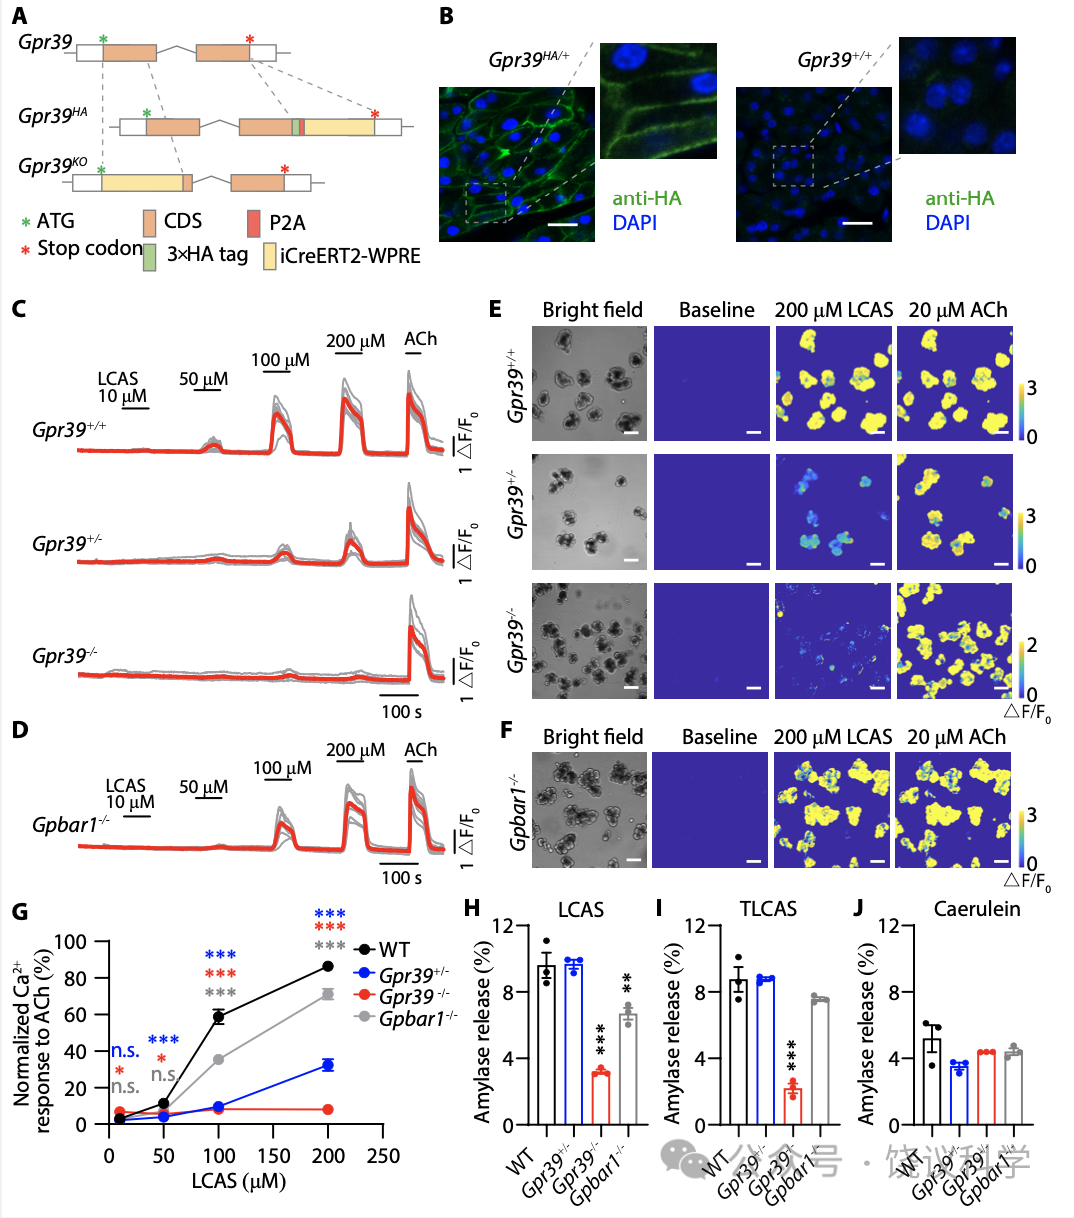
Figure 6. Requirement of GPR39 in Pancreatic Acinar Cells for BA Responses. (A) A schematic diagram of the generation of Gpr39HA and Gpr39KO mice. In brief, Gpr39HA mice were generated by insertion of three repeats of the HA epitope (3×HA) following with P2A-iCreERT2-WPRE at the C-terminus of GPR39. Gpr39KO mice were generated by replacing parts of exon 1 of the Gpr39 gene by iCreERT2-WPRE. (B) Immunofluorescence staining of Gpr39HA mice pancreatic sections with anti-HA antibody showed that GPR39 expressed in acinar cells. Scale bar in white is 20 μm. (C-D) Intracellular Ca2+ elevation induced by LCAS in acinar cells. Increasing concentrations of LCAS were used (from 10 to 200 mM). 20 mM ACh was used as a positive control at the end of each experiment to ensure the responsiveness of the acinar cells. Red traces represent the average responses. (E-F) Representative pseudo-colored images of intracellular Ca2+elevation in acinar cells before and after application of 200 μM LCAS. Scale bar in white is 50 μm. (G) Ca2+ signal peaks of indicated genotypes stimulated by LCAS of different concentrations, normalized to that of 20 mM ACh. Each genotype was compared with the WT with the same concentration of LCAS. One-way ANOVA with Tukey’s multiple comparisons posttest was used (***p<0.001, **p<0.01, *p<0.05, n.s. p>0.05, means + s.e.m). Colored stars were used to distinguish different genotypes. (H-J) BAs induced discharges of amylase were reduced in acini from GPR39 knockout mice. The net amylase release of acini treated with 500 μM LCAS (H), 500 μM TLCAS (I) or 1 nM caerulein (J) was shown as a percentage of total amylase. One-way ANOVA with Tukey’s multiple comparisons posttest was made to the WT group(***p<0.001, **p<0.01, means + s.e.m).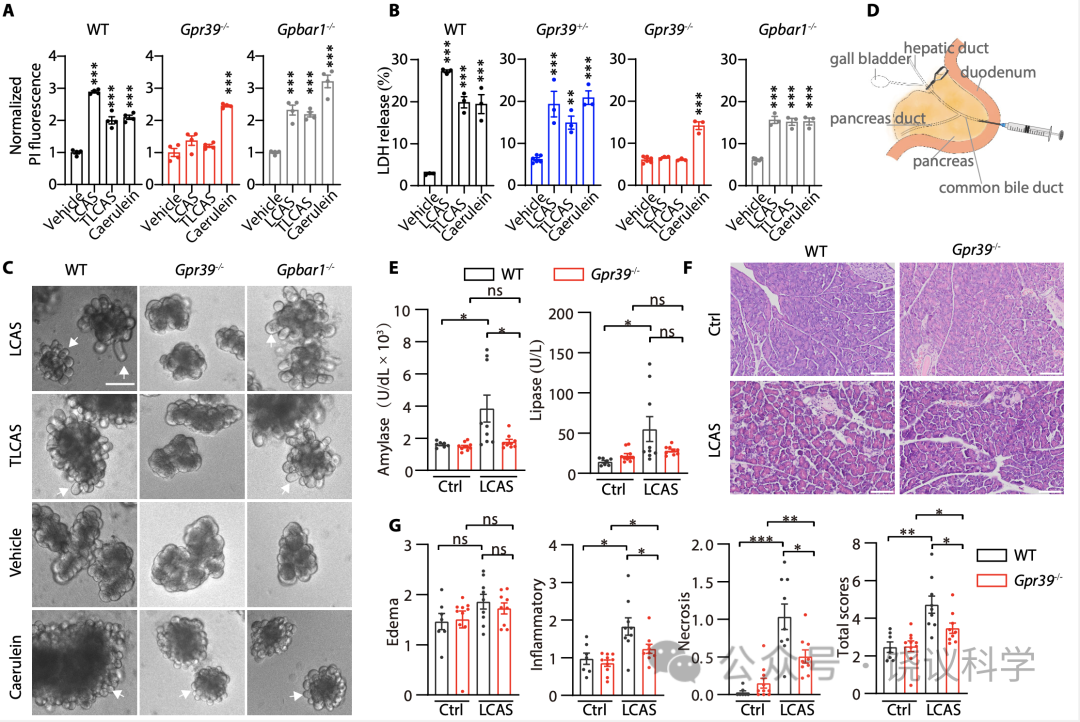
Figure 7. Deleting GPR39 Ameliorates Pancreatic Injuries by BA-Induced AP. (A-B) PI uptake (A) and LDH leakage (B) induced by LCAS and TLCAS required GPR39 but not GPBAR1. Acinar cells were incubated with LCAS (500 μM), TLCAS (500 μM) or caerulein (100nM) for 4 hours. PI fluorescence was normalized to that of vehicle-treated control and the net LDH leakage was expressed as a percentage of the total LDH. One-way ANOVA with Tukey’s multiple comparisons posttest was made to the vehicle group (**p<0.01,***p<0.001, means + s.e.m). (C) Representative images of acinar cell blebbing. Blebbing is denoted by arrows. Scale bar is 100 μm. (D) A schematic diagram of the pancreatic duct infusion-induced AP model. BAs were retrogradely injected into the pancreas through the pancreatic duct to induce AP. (E) Amylase and lipase levels in the serum of mice after LCAS-induced AP. Two-tailed unpaired Student’s t-test was used (***p<0.001, **p<0.01, *p<0.05, n.s. p>0.05, means + s.e.m). (F) Representative H&E staining of pancreatic histology in LCAS-induced AP. Scale bar in white is 50 μm. (G) Histopathology scores for edema, inflammatory cells infiltration, acinar cells necrosis and total scores. Two-tailed unpaired Student’s t-test was used (***p<0.001, **p<0.01, *p<0.05, n.s. p>0.05, means + s.e.m).
附图及其图注
